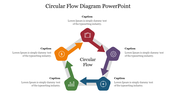
Create Cycle Diagram PowerPoint Presentation Template

Graphic of a cycle diagram showing three  labeled distinct areas, with a clean layout for text captions on the right side.
P.ID : 62100
    502 views
    101 Downloads
    Get Custom Slides by Experts
    Instantly Access Templates in PowerPoint

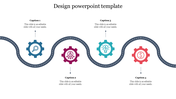
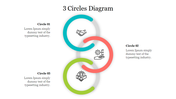
    Three Noded Cycle Diagram Slide

    If you are expecting a template that will help you creatively present your thoughts and ideas, you will love this Create Cycle Circle Diagram PowerPoint Template. This slide is suitable for a variety of industries and professionals. Its multifunctional use makes it ideal for a variety of occasions, including business presentations, conferences, and meetings. Download it right now! 

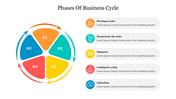
    The Create Cycle Diagram PowerPoint Template helps you to present ideas in an elegant manner, especially when you are presenting complicated concepts. Its colorful circular loop and text boxes will help you to explain the different phases of the process. This infographic template is highly customizable, so you can change the appearance as needed.

    Features of this template:

    1. 100% customizable slides and easy to download.
    2. Slides available in different nodes & colors.
    3. The slide contained 16:9 and 4:3 format.
    4. Easy to change the slide colors quickly.
    5. Well-crafted template with instant download facility.
    6. It has a beautiful circular loop design.
    Advertisement

    You May Also Like These PowerPoint Templates

    Add to Wishlist
    Download
    AI Customize
    Visual representation of Kotter's 8 Step change management model, highlighting each step in a colorful, upward progression.
    Add to Wishlist
    Download
    AI Customize
    Colorful circular infographic slide with four sections representing business, target, growth, and profit with icons.
    Add to Wishlist
    Download
    AI Customize
    Customizable Deforestation Causal Loop Diagram PowerPoint
    Free
    Add to Wishlist
    Download
    AI Customize
    Cycle diagram featuring six red sections arranged in a circular shape with arrows, each labeled with captions areas.
    Add to Wishlist
    Download
    AI Customize
    Business ecosystem slide with a circular flow chart showing technology related color coded icons on a white backdrop.
    Add to Wishlist
    Download
    AI Customize
    Deforestation slide with interconnected orange arrows, text nodes, and green elements inside a blue border.
    Add to Wishlist
    Download
    AI Customize
    Visual representation of a causal loop diagram focusing on irrigation management, with key loops.
    Add to Wishlist
    Download
    AI Customize
    Circular flow diagram of economics slide showing interactions between four colored sections on a white backdrop.
    Free
    Add to Wishlist
    Download
    AI Customize
    Hexagonal red circle infographic with six sections, each containing an icon and a caption.
    Add to Wishlist
    Download
    AI Customize
    Diagram illustrating the habit loop with three stageconnected by arrows in a circular flow, with placeholders text.
    Add to Wishlist
    Download
    AI Customize
    Circular loop slide illustrating four different components with percentage contributions and placeholder text.
    Add to Wishlist
    Download
    AI Customize
    Causal loop diagram slide illustrating factors influencing business activity and commercial space availability.
    Add to Wishlist
    Download
    AI Customize
    Best Circular Process Of Communication Model Slide
    Add to Wishlist
    Download
    AI Customize
    Colorful circular diagram with four arrows in teal, red, purple, and blue, each labeled with numbers.
    Add to Wishlist
    Download
    AI Customize
    Causal diagram on deforestation with interconnected loops, arrows, and orange circular feedback icons.
    Free
    Add to Wishlist
    Download
    AI Customize
    Green circular flowchart with five white icons, each connected to text boxes on the sides by arrows.
    Free
    Add to Wishlist
    Download
    AI Customize
    Circular diagram in shades of purple with six segments, each numbered and pointing to text boxes.
    Add to Wishlist
    Download
    AI Customize
    Circular project flow diagram with five stages displayed in colorful segments and arranged around a central icon.
    Add to Wishlist
    Download
    AI Customize
    Customizable Causal Loop Diagram PowerPoint Slide
    Add to Wishlist
    Download
    AI Customize
    Circular infographic design with four green icons representing business, goals, growth, and finance, arranged around arrows.