Use Our Editable Onion Diagram Presentation Template
Nodes
Colors



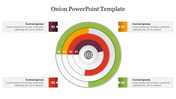

Onion diagram Slide
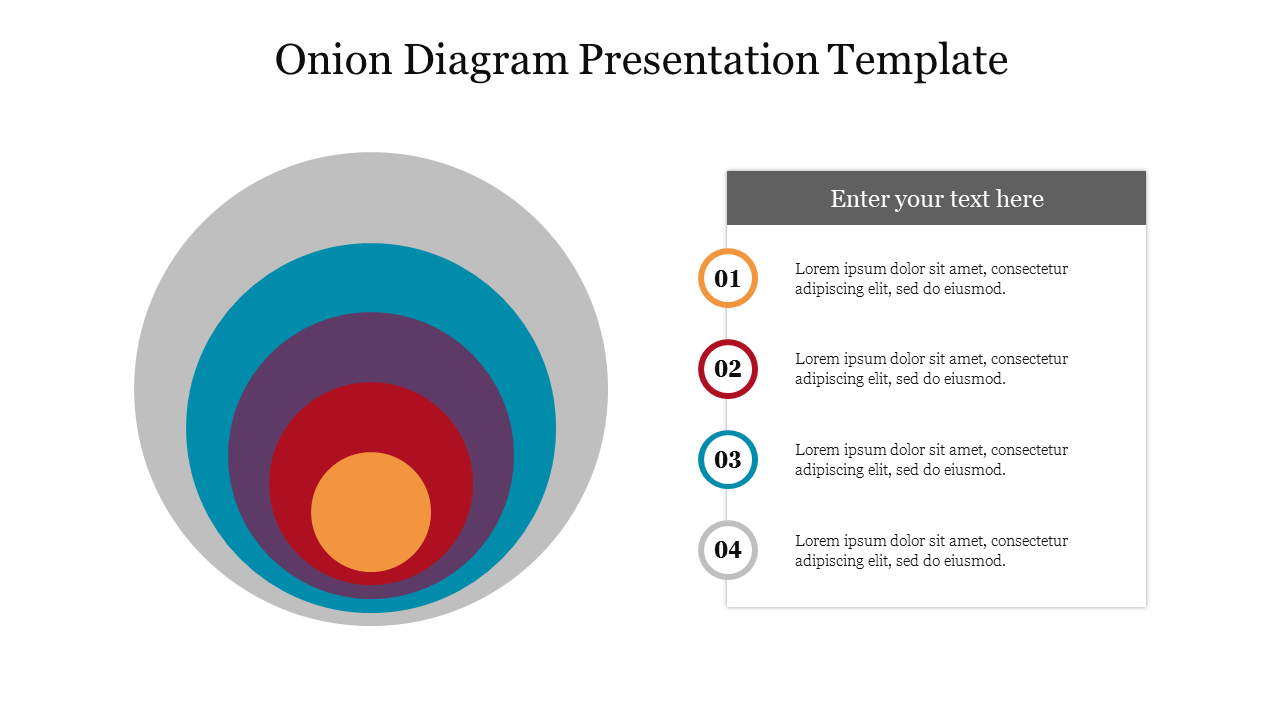
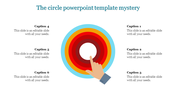
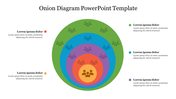
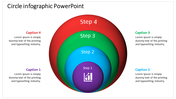
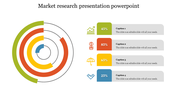
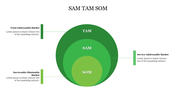
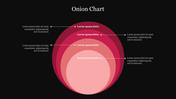
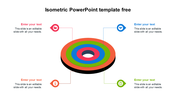
An onion diagram is a type of graphic organizer that is used to show the relationships between different concepts or ideas. It gets its name from the layers of an onion, as the diagram consists of a series of concentric circles that represent different levels of detail. The center circle represents the core concept or idea, with subsequent circles representing related concepts that build upon the core idea. The outermost circle represents the broader context in which these ideas exist. Onion diagrams can be used in a variety of contexts, from brainstorming and project planning to research and analysis. They are a versatile tool that can help clarify complex information and ideas in a visually appealing way.
Features of this template
- 100% Customizable template (shape color, size & text)
- Template are available in different nodes and colors.
- It supports an aspect ratio of 16:9 and 4:3
- Creative design with vibrant colors.
- Four nodes with text area.
- Peel back the layers of complexity with our onion diagram template.
- Highly compatible with PowerPoint, Google Slides and Canva templates
Explore Related Collections
Recommended based on this template.








You May Also Like These PowerPoint Templates

Showing20 of69,218 templates