MILESTONE 🌟 5 Million+ creative minds trust SlideEgg! Grab 80% OFF

Comparative Industry Structure Analysis PowerPoint

Comparative Industry Structure Analysis slide using spider diagram for rivalry, supplier power, and substitute threat.
P.ID : 75584
    1 views
    1 Downloads
    Get Custom Slides by Experts
    Enhance Your Presentations with Add-ins
    Google Slides Add-in
    Access templates directly in Google Slides
    Microsoft PowerPoint Add-in
    Access templates directly in PowerPoint
    GPT Add-on
    AI-powered presentation assistance

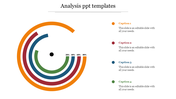
    Comparative Industry Structure Analysis PPT, Google Slides, And Canva Template


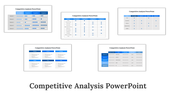
    Want to make your business strategy clear and smart? Use this Comparative Industry Structure Analysis PowerPoint Template to visually map out industry changes over time using radar graphs. This template is perfect for market researchers, business analysts, educators, and consultants who need to show how competitive forces evolve.


    This slide helps you compare market conditions at two different points (e.g., Time 0 and Time +5), making it easy to see shifts in rivalry, entry threats, substitute threats, supplier power, and buyer power. With a clean, professional radar chart at the center, your audience will instantly understand the dynamics of industry change.


    Whether you're explaining Porter’s Five Forces or showing how external pressures affect your strategy, this visual tool simplifies complex data into a story everyone can follow, even someone brand new to business concepts!


    Features of this template


    • 100% customizable slides and easy to download.
    • The slides contain 16:9 and 4:3 formats.
    • Easy to change the colors quickly.
    • Highly compatible with PowerPoint, Google Slides, and Canva templates.
    Advertisement

    You May Also Like These PowerPoint Templates

    Add to Wishlist
    Download
    AI Customize
    Financial slide deck with a navy blue theme, featuring sections on company mission, analysis types, and team profiles.
    Free
    Add to Wishlist
    Download
    AI Customize
    Add to Wishlist
    Download
    AI Customize
     slide featuring three circular charts for data analysis, followed by a line chart displaying monthly trends.
    Add to Wishlist
    Download
    AI Customize
    Pack of slides with colorful icons and sections for various data analysis, including visuals and layouts.
    Add to Wishlist
    Download
    AI Customize
    Market analysis template with seven numbered steps arranged around a central magnifying glass icon over a pink background.
    Add to Wishlist
    Download
    AI Customize
    Five numbered hexagons in red, orange, green, teal, and blue, each with text inside.
    Free
    Add to Wishlist
    Download
    AI Customize
    Vertical bar chart with five captions and a magnifying glass highlighting one, and numbered list with text on the right.
    Add to Wishlist
    Download
    AI Customize
    Performance slide with four quadrants in red, green, teal, and blue, connected in a circular flow with relevant text.
    Add to Wishlist
    Download
    AI Customize
    Slide deck showcasing ratio analysis elements with colorful geometric designs and icons, highlighting financial metrics.
    Add to Wishlist
    Download
    AI Customize
    Collection of slides showing different styles like diamonds, hexagons, and flowcharts, with ethical principles.
    Add to Wishlist
    Download
    AI Customize
    Data analysis slide with a monitor showing analytics icons, and five colorful speech bubbles indicating various steps around it.
    Add to Wishlist
    Download
    AI Customize
    A reflective learning process slide shows four stages each in colorful boxes with text descriptions.
    Add to Wishlist
    Download
    AI Customize
    Slide featuring five colorful cylindrical bar charts labeled with data analytics categories with percentages from 23% to 75%.
    Add to Wishlist
    Download
    AI Customize
    Financial analysis PowerPoint template with a money bag icon and six options for financial topics.
    Add to Wishlist
    Download
    AI Customize
    Slide showing financial data with a smiling cartoon businessman and two green-highlighted doughnut graphs.