Attractive Business Strategy Diagram PowerPoint Template

Circular business strategy diagram with eight colored icons, each linked to descriptive text on both sides.
P.ID : 67835
    125 views
    17 Downloads
    Get Custom Slides by Experts
    Instantly Access Templates in PowerPoint

    Attractive Business Strategy Diagram PowerPoint Template

    Create business strategy presentations with this Attractive Business Strategy Diagram PowerPoint Template. This is a 100% user-friendly template. This is a well-made template with a professional touch. This pre-built template helps you in creating presentations in no time. This is a 100% user-friendly template.

    About the template:

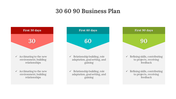
    This Attractive Business Strategy Diagram PowerPoint Template is one of the stunning strategy/business plan templates from SlideEgg. This is a six nodded template. 

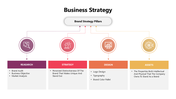
    This template has eight vibrant circular rings embedded with each other in a circular structure. It is placed at the center of this template. The nodes are vertically arranged on both sides of this node arrangement.

    Use this flawless template for all your persuasive business presentations. Grab now!!!

    Features of this template:

    • 100% customizable slides and easy to download.
    • Slides available in different nodes & colors.
    • The slide contained 16:9 and 4:3 format.
    • Easy to change the slide colors quickly.
    • Well-crafted template with instant download facility. 
    • Elegant eight-node featured template.
    • Premium template with exuberant features.
    Advertisement

    You May Also Like These PowerPoint Templates

    Add to Wishlist
    Download
    AI Customize
    Business marketing management slide featuring a confident businessman in a suit with vibrant yellow and gray design elements.
    Add to Wishlist
    Download
    AI Customize
    Value proposition chart slide showing a visual relationship between customer profile and value map components with icons.
    Add to Wishlist
    Download
    AI Customize
    A circular timeline diagram with colorful segments for each year from 2017 to 2022, arranged around a central circle.
    Free
    Add to Wishlist
    Download
    AI Customize
    A business analytics PowerPoint slide featuring four sections, each with icons and placeholder text.
    Add to Wishlist
    Download
    AI Customize
    Core Competencies Model illustrating the flow from Business to Competitive Advantage with intermediate steps.
    Add to Wishlist
    Download
    AI Customize
    Five step business process diagram with colorful circular icons, linked by a wavy line across the slide.
    Add to Wishlist
    Download
    AI Customize
    Customizable Deforestation Causal Loop Diagram PowerPoint
    Add to Wishlist
    Download
    AI Customize
    A circular process improvement diagram with seven colored arrows around a handshake icon in the center with caption area.
    Add to Wishlist
    Download
    AI Customize
    Circular diagram for robotic automation process with six segments, each numbered and paired with  text boxes on the sides.
    Free
    Add to Wishlist
    Download
    AI Customize
    Central circle with a bar chart surrounded by six orange hexagons with icons representing different elements.
    Free
    Add to Wishlist
    Download
    AI Customize
    Cycle diagram featuring six red sections arranged in a circular shape with arrows, each labeled with captions areas.
    Free
    Add to Wishlist
    Download
    AI Customize
    Four piece circular puzzle template with icons for analytics, briefcase, team, and chat with placeholder text.
    Free
    Add to Wishlist
    Download
    AI Customize
    Four green puzzle pieces arranged in a circular pattern, each segment containing an icon with text on the side.
    Add to Wishlist
    Download
    AI Customize
    Business ecosystem slide with a circular flow chart showing technology related color coded icons on a white backdrop.
    Add to Wishlist
    Download
    AI Customize
    Deforestation slide with interconnected orange arrows, text nodes, and green elements inside a blue border.
    Add to Wishlist
    Download
    AI Customize
    Visual representation of a causal loop diagram focusing on irrigation management, with key loops.
    Add to Wishlist
    Download
    AI Customize
    Circular flow diagram of economics slide showing interactions between four colored sections on a white backdrop.
    Add to Wishlist
    Download
    AI Customize
    Six-segment semi-circle diagram with central star icon and various colored icons, each section labeled with captions areas.
    Free
    Add to Wishlist
    Download
    AI Customize
    Hexagonal red circle infographic with six sections, each containing an icon and a caption.