Business PowerPoint Ideas Template and Google Slides

Revolutionize Your Business Ideas Presentations with Our Template
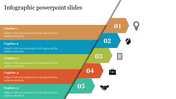
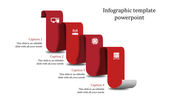
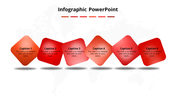
Looking to inject creativity into your business presentations? Our Business PowerPoint Ideas Template and Google Slides Themes offer the perfect solution. With six vibrant red-themed circles, each adorned with an icon, caption, and text area, this template is tailored to meet the needs of professionals across various industries. Whether you're a startup founder, corporate executive, marketer, or educator, our template provides a versatile platform to showcase your ideas, strategies, and insights with clarity and impact. Engage your audience and elevate your presentations to new heights with dynamic visuals that leave a lasting impression. With its user-friendly design and customizable features, this template empowers you to craft compelling slides that captivate and inspire. Embrace innovation and unlock your full potential with our template.
Features of the template
- 100% customizable slides are easy to download.
- Slides are available in different colors.
- The slide has 4:3 and 16:9 formats.
- It is easy to change the slide colors quickly.
- It has a cute design to impress an audience.
- Create feature-rich, animated presentations.


You May Also Like These PowerPoint Templates
Add to Wishlist
Download
Edit

Add to Wishlist
Download
Edit

Add to Wishlist
Download
Edit


Add to Wishlist
Download
Edit


Add to Wishlist
Download
Edit

Add to Wishlist
Download
Edit

Add to Wishlist
Download
Edit

Add to Wishlist
Download
Edit

Add to Wishlist
Download
Edit

Add to Wishlist
Download
Edit


Add to Wishlist
Download
Edit

Add to Wishlist
Download
Edit

Add to Wishlist
Download
Edit


Add to Wishlist
Download
Edit

Add to Wishlist
Download
Edit

