Best Business Growth PPT Slide Presentation

Business growth strategy PPT slide with four colored stages from diversification to market penetration with icons.
P.ID : 56520
    212 views
    33 Downloads
    Get Custom Slides by Experts
    Instantly Access Templates in PowerPoint

    Stunning Infographic Slide To Show Your Business Growth

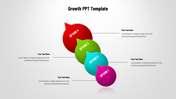
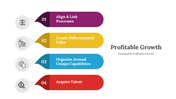
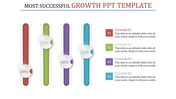
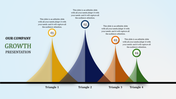
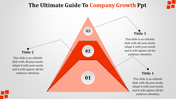
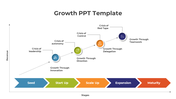
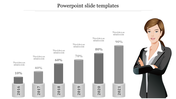
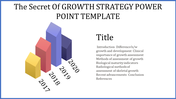
    Analyzing and measuring a business's growth is based on defining long-term goals, determining the measures for success, setting up meaningful KPIs, tracking your competition, measuring marketing effectiveness, and more. You can use our business growth PPT slide to present and analyze the growth. We made this business slide with innovative 3D steps model infographics with four multicolor nodes and icons representing the four stages of your growth. Text holders are added with captions for a detailed presentation. It will be the greatest choice for startups to any kind of business to communicate their evolution. Get it today to live up to your expectations!

    Features of the template

    • 100% customizable slides and easy to download.
    • Slides are available in different nodes & colors.
    • The slide contains 16:9 and 4:3 formats.
    • Easy to change the colors of the slide quickly.
    • Well-crafted template with an instant download facility.
    • Innovative slide to grab your audience's eyes.
    Advertisement

    You May Also Like These PowerPoint Templates

    Free
    Add to Wishlist
    Download
    AI Customize
    Illustration of company growth with percentages and a character holding a briefcase and calculator, alongside tech elements.
    Free
    Add to Wishlist
    Download
    AI Customize
    Company growth slide featuring a blue background, two data charts, and an image of a professional man.
    Add to Wishlist
    Download
    AI Customize
    Business infographic featuring megaphone, analytics graph board, and partnership handshake icon, with caption areas.
    Add to Wishlist
    Download
    AI Customize
    Business growth infographic with orange segments, diagonal growth line, and labeled stages of organizational development.
    Add to Wishlist
    Download
    AI Customize
    Central tree icon with concentric circles in green, blue, orange, and yellow, surrounded by four numbered circular icons.
    Free
    Add to Wishlist
    Download
    AI Customize
    PowerPoint template showcasing growth with a tree shaped structure and percentage data points on branches.
    Add to Wishlist
    Download
    AI Customize
    Growth PPT slide with three stages showing increasing amounts with corresponding captions.
    Free
    Add to Wishlist
    Download
    AI Customize
    Growth PowerPoint template featuring three mountain peaks with trees and captions for each section.
    Add to Wishlist
    Download
    AI Customize
    Four curved steps labeled A to D in blue, green, red, and purple, representing growth hacking techniques.
    Add to Wishlist
    Download
    AI Customize
    Four upward pointing rocket shapes in orange, red, blue, and green with growth metrics and a sidebar listing captions.
    Free
    Add to Wishlist
    Download
    AI Customize
    PowerPoint slide with a growth strategy theme, showing plant pots in different stages of growth with corresponding captions.
    Add to Wishlist
    Download
    AI Customize
    Four growth stages represented by plants above colored boxes with captions in purple, red, yellow, and blue.
    Free
    Add to Wishlist
    Download
    AI Customize
    PowerPoint slide showing a colorful company growth chart with progress percentages over the years with placeholder text.
    Free
    Add to Wishlist
    Download
    AI Customize
    Circular growth chart slide showcasing data with layered segments and percentages, paired with icons for transport modes.
    Free
    Add to Wishlist
    Download
    AI Customize
    Mountain themed layout with six numbered milestones connected by paths, trees at the base, and captions for growth stages.
    Free
    Add to Wishlist
    Download
    AI Customize
    Red cylindrical bar chart with percentages from 60% to 90% for years 2018 to 2021, with a businesswoman illustration.
    Add to Wishlist
    Download
    AI Customize
    Growth chart with green bars and a red arrow rising diagonally with a figure running on it and a text at the left.