Best Analytics Presentation Template And Google Slides

Analytics slide featuring four gray highlighted sections with icons and descriptions, arranged in a row.
P.ID : 23174
    21 slides
    Financial slide deck with a navy blue theme, featuring sections on company mission, analysis types, and team profiles.
    16 slides
    Statistical analysis slides show stages with different colorful layout designs with detailed descriptions.
    11 slides
    GROW model colorful diagram PPT slides showing the stages with corresponding questions for each stage with layout design.
    206 views
    1 Downloads
    Get Custom Slides by Experts
    Instantly Access Templates in PowerPoint

    Simple Analytics Presentation Template


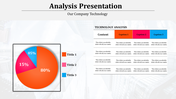
    Struggling to turn your data analysis into a clear story that gets results? You're not alone. Data analysts often drown in charts and graphs, leaving their audience confused.

    This frustration is why we created the Analytics Presentation template. Think of it as your secret weapon for transforming complex data into impactful stories.

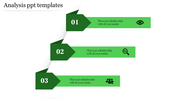
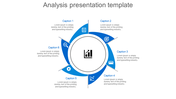
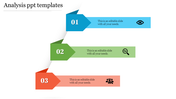
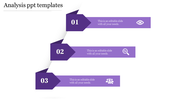
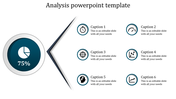
    Imagine a bright white canvas with four simple gray boxes. Each box is a building block for your data journey. Fill in the titles, captions, and text areas to showcase your key metrics and insights – quickly and easily.

    This template is perfect for data analysts who want to:
    • Wow, senior management with clear presentations of complex statistical models.
    • Help the marketing team understand A/B test results in a flash.
    • Justify resource allocation with data-driven confidence.

    Download the Analytics Presentation template today and turn your informative presentations into influential ones that drive action!

    Features of the template


    • 100% customizable slides and easy to download.
    • The slides contain 16:9 and 4:3 formats.
    • Easy to change the colors quickly.
    • It is a well-crafted template with an instant download facility.
    • It is a 100% pre-designed slide.
    • The slide holds vibrant colors.
    Advertisement

    You May Also Like These PowerPoint Templates

    Add to Wishlist
    Download
    AI Customize
    Analytics tactics slide with four numbered captions in orange, red, blue, and green, each paired with relevant icons.
    Free
    Add to Wishlist
    Download
    AI Customize
    Competitor analysis chart slide comparing four companies across various categories.
    Free
    Add to Wishlist
    Download
    AI Customize
    Infographic with five stacked arrows in red, pink, orange, blue, and purple, alongside a human silhouette in matching hues.
    Free
    Add to Wishlist
    Download
    AI Customize
    Silhouette of a businessman at the center, connected to six colorful caption boxes with numbered steps on both sides.
    Free
    Add to Wishlist
    Download
    AI Customize
    Dark slide with a blue circular core, surrounded by four white rectangular boxes with arrows pointing towards the center.
    Add to Wishlist
    Download
    AI Customize
    Financial infographic with a yellow piggy bank and vertical upward arrows showing percentages and captions on both sides.
    Free
    Add to Wishlist
    Download
    AI Customize
    Circular diagram representing porter’s five forces with a central rivalry node linked to four external forces.
    Add to Wishlist
    Download
    AI Customize
    Purple analytics PowerPoint template with sequentially numbered arrows, each with a different icon for key business metrics.
    Add to Wishlist
    Download
    AI Customize
    Innovative  PESTEL Analysis PowerPoint Template Slides
    Free
    Add to Wishlist
    Download
    AI Customize
    Engineer-focused slide with a figure in a yellow hard hat, flanked by green arrows denoting processes.
    Add to Wishlist
    Download
    AI Customize
    Colorful PESTLE analysis template with each section labeled for different business factors with placeholder text.
    Free
    Add to Wishlist
    Download
    AI Customize
    Timeline template showing a journey from 2016 to 2020 with icons for research, finance, analytics, intelligence, and success.
    Add to Wishlist
    Download
    AI Customize
    Social media icons with placeholder text and four colorful data icons on the right.
    Add to Wishlist
    Download
    AI Customize
    Results template showing research and analysis steps, with visual data on men and women in a company showings their earnings.
    Add to Wishlist
    Download
    AI Customize
    Business analysis bar chart slide with six colored bars representing different activities and percentages with text area.
    Add to Wishlist
    Download
    AI Customize
    A pack of slides with a colorful SCQA framework illustrating icons with visual charts and layouts.
    Add to Wishlist
    Download
    AI Customize
    The thematic analysis slide diagram shows the process from qualitative data to codes and themes in three colors.
    Add to Wishlist
    Download
    AI Customize
    Analysis PowerPoint Presentation And Google Slides Themes