Use Our Predesigned Analytics PowerPoint Template Designs
Get Custom Slides by Experts
Enhance Your Presentations with Add-ins
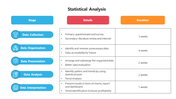
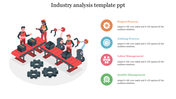
Editable Social Media Analytics Infographic Template
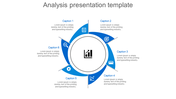
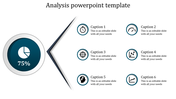
Welcome to our Advanced Analytics PowerPoint Template, where data visualization meets storytelling, creating a powerful tool for professionals, students, and anyone seeking to convey complex information with clarity. A multi-dimensional Analysis radar chart, color-coded for easy differentiation, awaits your data. Each axis represents different options, providing a comprehensive view. Whether it’s sales, operational costs, or project progress, this chart simplifies complexity. Managers, analysts, and decision-makers can leverage this template to present data-driven insights during board meetings, client pitches, or internal reviews. Download our Templates and Google Slides Themes step into a world where every figure is part of an engaging narrative.
Features of the template:
- Slides are available in 4:3 & 16:9
- Well-crafted template with instant download.
- Get slides that are 100% customizable and easy to download
You May Also Like These PowerPoint Templates