Editable Analysis PowerPoint Template With Six Node


Effective Analysis PowerPoint Template
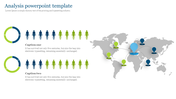
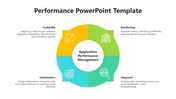
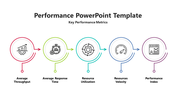
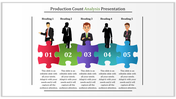
Our analysis PowerPoint template is created to help you present your data analysis in a concise and visually appealing manner.
Slide Description:
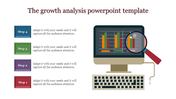
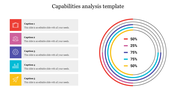
This template is divided into two parts: on one side there are six color-coded bars with percentages on the blue background and on the opposite side the picture shows a hand with a pen in it drawing the chart. It is easy to compare data from one bar to another due to its color-coded pattern; the use of hand-drawing chart images makes it unique.
Who can use this template?
Designed for data analysts, financial experts, researchers, and business professionals who will be required to present complex data simply.
This universal analysis PowerPoint template is waiting for you to download now.
Features of the template
- 100% customizable slides and easy to download.
- The slides contain 16:9 and 4:3 formats.
- Easy to change the colors quickly.
- It is a well-crafted template with an instant download facility.
- It is a 100% pre-designed slide.
- The slide holds vibrant colors.


You May Also Like These PowerPoint Templates
Add to Wishlist
Download
Edit

Add to Wishlist
Download
Edit

Add to Wishlist
Download
Edit

Add to Wishlist
Download
Edit

Add to Wishlist
Download
Edit

Add to Wishlist
Download
Edit

Add to Wishlist
Download
Edit

Add to Wishlist
Download
Edit

Add to Wishlist
Download
Edit

Add to Wishlist
Download
Edit

Add to Wishlist
Download
Edit

Add to Wishlist
Download
Edit


Add to Wishlist
Download
Edit

Add to Wishlist
Download
Edit

Add to Wishlist
Download
Edit

Add to Wishlist
Download
Edit

Add to Wishlist
Download
Edit

Add to Wishlist
Download
Edit

Add to Wishlist
Download
Edit
