Creative Analysis PowerPoint Template and Google Slides

Illustrative layout with orange accents, buildings, people, and three circular growth indicators on a beige background.
P.ID : 15448
    203 views
    12 Downloads
    Get Custom Slides by Experts
    Instantly Access Templates in PowerPoint

    Analysis PowerPoint Template and Google Slides

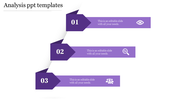
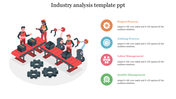
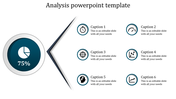
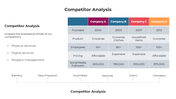
    The Analysis PowerPoint Template and Google Slides offer a comprehensive platform for visualizing data analysis and insights. The slide titled "The Most Out of Analysis PowerPoint Template" showcases an isometric illustration of a bustling cityscape, symbolizing the dynamic nature of data analysis. Additionally, three growth charts with different percentages are incorporated, highlighting the analytical outcomes.

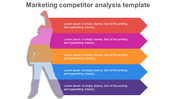
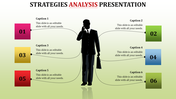
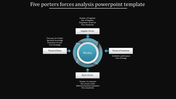
    Tailored for data analysts, business professionals, researchers, and educators aiming to present analytical findings, trends, and projections. Ideal for data-driven presentations, financial reports, market analysis, and strategic planning. Relevant for analysts, consultants, managers, executives, and educators seeking to communicate analytical insights effectively.

    Compatible with PowerPoint and Google Slides, ensuring accessibility and ease of use. Available in "16:9" and "4:3" aspect ratios, as well as zip formats, for versatile deployment. Free and fully customizable template.  Download now and unlock the potential of your data!
    Advertisement

    You May Also Like These PowerPoint Templates

    Add to Wishlist
    Download
    AI Customize
    Financial infographic with a yellow piggy bank and vertical upward arrows showing percentages and captions on both sides.
    Free
    Add to Wishlist
    Download
    AI Customize
    Circular diagram representing porter’s five forces with a central rivalry node linked to four external forces.
    Add to Wishlist
    Download
    AI Customize
    Purple analytics PowerPoint template with sequentially numbered arrows, each with a different icon for key business metrics.
    Add to Wishlist
    Download
    AI Customize
    Innovative  PESTEL Analysis PowerPoint Template Slides
    Free
    Add to Wishlist
    Download
    AI Customize
    Engineer-focused slide with a figure in a yellow hard hat, flanked by green arrows denoting processes.
    Add to Wishlist
    Download
    AI Customize
    Colorful PESTLE analysis template with each section labeled for different business factors with placeholder text.
    Free
    Add to Wishlist
    Download
    AI Customize
    Timeline template showing a journey from 2016 to 2020 with icons for research, finance, analytics, intelligence, and success.
    Add to Wishlist
    Download
    AI Customize
    Social media icons with placeholder text and four colorful data icons on the right.
    Add to Wishlist
    Download
    AI Customize
    Results template showing research and analysis steps, with visual data on men and women in a company showings their earnings.
    Add to Wishlist
    Download
    AI Customize
    Business analysis bar chart slide with six colored bars representing different activities and percentages with text area.
    Add to Wishlist
    Download
    AI Customize
    A pack of slides with a colorful SCQA framework illustrating icons with visual charts and layouts.
    Add to Wishlist
    Download
    AI Customize
    The thematic analysis slide diagram shows the process from qualitative data to codes and themes in three colors.
    Add to Wishlist
    Download
    AI Customize
    Analysis PowerPoint Presentation And Google Slides Themes
    Free
    Add to Wishlist
    Download
    AI Customize
    Download Financial Analysis PowerPoint Presentation
    Add to Wishlist
    Download
    AI Customize
    Dupont analysis overview slides illustrating the calculation of profit margin with different layout designs with icons.
    Add to Wishlist
    Download
    AI Customize
    Current state analysis slide comparing cost reduction and value creation strategies with two colored boxes and text caption.