Analysis PowerPoint Presentation Template for Data Insights

Analysis PowerPoint template displaying respondents divided into promoters, passives, and detractors based on NPS scores.
P.ID : 34433
    98 views
    6 Downloads
    Get Custom Slides by Experts
    Instantly Access Templates in PowerPoint

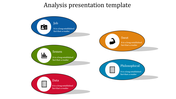
    Analysis Presentation Template


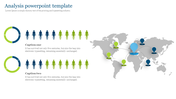
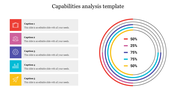
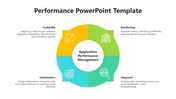
    Imagine a presentation that not only shows numbers but also helps you see important patterns and trends. Our Analysis PowerPoint Template is made to help you explain your findings simply and interestingly. The template has a clean white background with a clear image of a Net Promoter Score (NPS) divided into three sections. This design helps you explain customer satisfaction data well, showing the main trends and making it easy for your audience to understand.

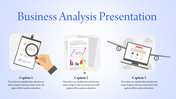
    Whether you're a business analyst sharing market research, a data scientist showing your discoveries, or a student presenting a research project, this template can help you make great presentations. Just add your data, charts, and pictures to the slides, and use the template's layout to make presentations that are easy to understand and interesting. Download this template now and start making presentations that show what your data means!

    Features of the template


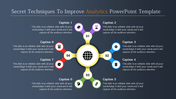
    • Slides are available in different nodes & colors.
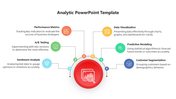
    • Easy to change the slide colors.
    • Well-crafted template with instant download.
    • Highly compatible with PowerPoint and Google Slides.
    Advertisement

    You May Also Like These PowerPoint Templates

    Add to Wishlist
    Download
    AI Customize
    Vibrant PESTLE chart dividing political, economic, social, technological, legal, and environmental aspects.
    Add to Wishlist
    Download
    AI Customize
    Analysis template with a man looking through a magnifying glass at a computer screen with four types and caption areas.
    Add to Wishlist
    Download
    AI Customize
    Step-by-step analysis diagram with a central focus on analysis, flanked by six green-highlighted steps.
    Add to Wishlist
    Download
    AI Customize
    Data analytics layout featuring a central gray magnifying glass and three orange icons linked to labeled sections.
    Add to Wishlist
    Download
    AI Customize
    Molecular-style infographic with interconnected colored nodes linked to six labeled captions for analysis ideas.
    Add to Wishlist
    Download
    AI Customize
    Central hexagonal shape with multicolor triangles around and two text areas with bar chart and coin stack with percentages.
    Add to Wishlist
    Download
    AI Customize
    Business Analytics slide featuring three stages with icons representing question, insight, and growth.
    Add to Wishlist
    Download
    AI Customize
    Data analysis template with a bar graph and illustrated dashboard layout with two caption areas for data.
    Add to Wishlist
    Download
    AI Customize
    Illustration of a person analyzing charts in blue accents, with four analysis types listed on the right.
    Add to Wishlist
    Download
    AI Customize
    Grid layout with five red boxes for why labels and three columns in blue, green, and purple for answers.
    Add to Wishlist
    Download
    AI Customize
    Four colorful vertical banners in yellow, red, blue, and green with icons, title, and descriptions for web analytics uses.
    Add to Wishlist
    Download
    AI Customize
    Data analysis featuring icons for data interpretation, market research, and performance evaluation.
    Add to Wishlist
    Download
    AI Customize
    Competitor analysis chart with four quadrants representing high and low price and quality, showing competitor circles.
    Free
    Add to Wishlist
    Download
    AI Customize
    Amazing Business Analytics PPT Templates and Google Slides
    Add to Wishlist
    Download
    AI Customize
     slide featuring three circular charts for data analysis, followed by a line chart displaying monthly trends.
    Add to Wishlist
    Download
    AI Customize
    Banking data analysis slide with green bar chart on a computer screen and three listed issues in circles on the right.
    Add to Wishlist
    Download
    AI Customize
    Data analysis slide with a monitor showing analytics icons, and five colorful speech bubbles indicating various steps around it.
    Add to Wishlist
    Download
    AI Customize
    Slide with a blue sidebar featuring a document icon, two captions in yellow and orange circles, and text at bottom.
    Add to Wishlist
    Download
    AI Customize
    Analysis slide featuring a magnifying glass over banana, with three circular progress charts in green, orange, and yellow.