Best Analysis PowerPoint Template Presentation Design

Magnifying glass zooming in on a document, showcasing an analysis PowerPoint template with captions.
P.ID : 14438
    188 views
    11 Downloads
    Get Custom Slides by Experts
    Instantly Access Templates in PowerPoint

    Analysis PowerPoint Template and Google Slides Themes


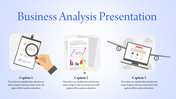
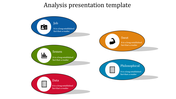
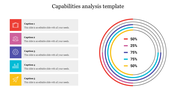
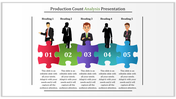
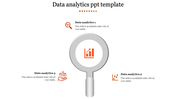
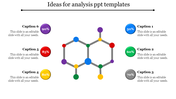
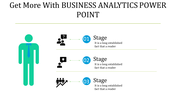
    Streamline your presentations with our Analysis PowerPoint Template and Google Slides Themes. Featuring six nodes, each with a captivating caption, title holder, and text area, this template makes complex data easy to understand. Whether you're a data analyst, consultant, or educator, engage your audience and drive your message home with visual storytelling.

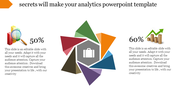
    Integrate key findings, trends, and projections seamlessly into your presentations, captivating your audience with compelling visuals and insightful analysis. Elevate your presentations, leaving a lasting impression and facilitating meaningful discussions. Transform the way you present data—empower your audience to make informed decisions with our Analysis PowerPoint Template and Google Slides Themes.

    Features of the Template


    • 100 % customizable slides.
    • The slide show is in 4:3, 16:9, zip format.
    • There is powerful connectivity with Google Slides and PowerPoint.
    • It is simple and quick to alter the slide's color.
    • An efficient template that can be easily accessed immediately.
    • Well-crafted template with an instant download facility.
    Advertisement

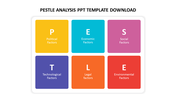
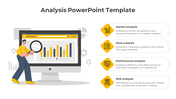
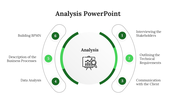
    You May Also Like These PowerPoint Templates

    Add to Wishlist
    Download
    AI Customize
    Data analysis template with a bar graph and illustrated dashboard layout with two caption areas for data.
    Add to Wishlist
    Download
    AI Customize
    Illustration of a person analyzing charts in blue accents, with four analysis types listed on the right.
    Add to Wishlist
    Download
    AI Customize
    Grid layout with five red boxes for why labels and three columns in blue, green, and purple for answers.
    Add to Wishlist
    Download
    AI Customize
    Four colorful vertical banners in yellow, red, blue, and green with icons, title, and descriptions for web analytics uses.
    Add to Wishlist
    Download
    AI Customize
    Data analysis featuring icons for data interpretation, market research, and performance evaluation.
    Add to Wishlist
    Download
    AI Customize
    Competitor analysis chart with four quadrants representing high and low price and quality, showing competitor circles.
    Free
    Add to Wishlist
    Download
    AI Customize
    Amazing Business Analytics PPT Templates and Google Slides
    Add to Wishlist
    Download
    AI Customize
     slide featuring three circular charts for data analysis, followed by a line chart displaying monthly trends.
    Add to Wishlist
    Download
    AI Customize
    Banking data analysis slide with green bar chart on a computer screen and three listed issues in circles on the right.
    Add to Wishlist
    Download
    AI Customize
    Data analysis slide with a monitor showing analytics icons, and five colorful speech bubbles indicating various steps around it.
    Add to Wishlist
    Download
    AI Customize
    Slide with a blue sidebar featuring a document icon, two captions in yellow and orange circles, and text at bottom.
    Add to Wishlist
    Download
    AI Customize
    Analysis slide featuring a magnifying glass over banana, with three circular progress charts in green, orange, and yellow.
    Add to Wishlist
    Download
    AI Customize
    Four staggered colored bars in blue, green, yellow, and purple with icons and captions aligned horizontally.
    Add to Wishlist
    Download
    AI Customize
    Stakeholder analysis slide showing a group of professionals discussing laptops in a meeting room.
    Add to Wishlist
    Download
    AI Customize
    Central speedometer icon with curved black line and five connected colored circles linking labeled sections.
    Add to Wishlist
    Download
    AI Customize
    Four hexagons in red, blue, yellow, and green, each with a relevant financial icon and captions around it.
    Add to Wishlist
    Download
    AI Customize
    Three segmented semi circular diagram in blue tones with icons, and a black magnifying glass overlaying a head symbol.