Free - Attractive Technology Slides Templates for your presentation
 Canva
Canva



Map Eight Connected Technology Actions on One PPT Slide
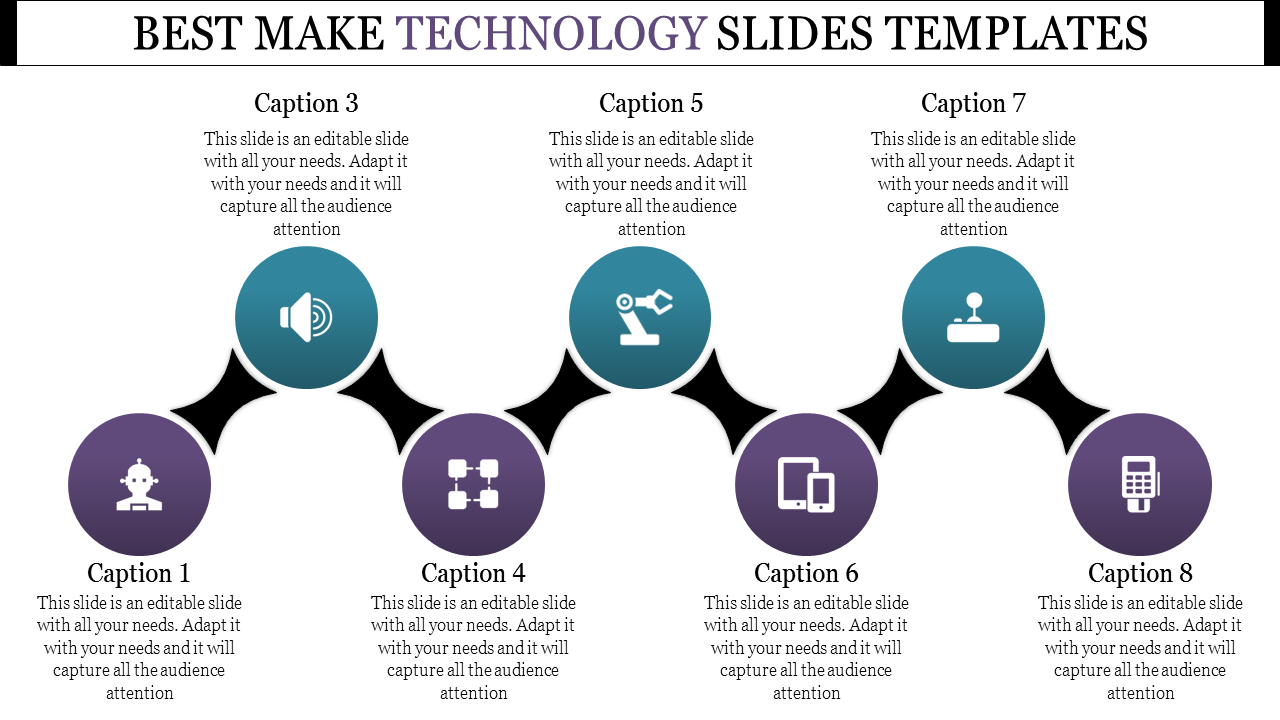
When a technology process contains more than four or five stages, squeezing every point into a straight row can make the slide difficult to read. This single-slide infographic solves that problem by arranging eight circular nodes along an alternating path.
The audience can follow the connected black line from left to right while the captions move between the top and bottom of the slide. This gives each point more room without losing the sequence connecting them.
Where the Eight-Node Layout Works Best
Adapt the slide to explain:
An eight-stage technology implementation roadmap
Steps in a software or product-development lifecycle
Activities within a digital-transformation program
The progression from user requirement to deployed solution
Eight connected IT services or system capabilities
A technology audit, migration or adoption process
The existing icons suggest subjects such as users, audio, connected systems, automation, multiple devices, digital controls and calculation. Replace any symbol that does not accurately represent your process.
Make the Two Colours Carry Meaning
Instead of treating the teal and purple nodes as decoration, use them to separate two types of information. For example:
Teal nodes can represent system actions while purple nodes represent user actions.
One colour can show planning tasks and the other implementation tasks.
The colours can distinguish internal responsibilities from external activities.
One set can represent completed stages and the other upcoming work.
This creates an extra layer of meaning without adding another legend or diagram.
Keep every caption focused on one action. Begin the heading with a verb—such as assess, select, configure, or review—and use the supporting text to explain the expected output. Similar caption lengths will preserve the slide’s balance and make the eight stages easier to scan.
What the Download Actually Contains
This product contains one infographic slide, not a complete technology deck. All eight caption areas currently hold placeholder text, so the template does not include a prepared technology process, research or technical guidance. Its value lies in the visual structure that you populate with your own information.
The slide is provided in 16:9 and 4:3 formats and can be customized in PowerPoint, Google Slides and Canva. The product page’s Edit option also lets you adjust the design online.
If your process requires decision points, branches or departmental handoffs, choose a more formal layout from the Flowchart PowerPoint Templates collection. For diagrams built around other technical subjects and structures, browse the parent Technology Presentation Templates collection.


You May Also Like These PowerPoint Templates

Showing20 of69,218 templates