Funnel Model SAM VS TAM PowerPoint Presentation Template

Colorful diagram illustrating the breakdown of market sizes for TAM, SAM, and SOM with corresponding financial figures.
P.ID : 62020
    9 slides
    Slides explaining TAM, SAM, and SOM using pie charts, graphs, and color coded diagrams with icons.
    36 slides
    Infographic slides showcasing the TAM, SAM, and SOM models with colorful visuals and business related information.
    14 slides
    Slide deck displaying various diagrams for TAM, SAM, and SOM with orange, red, and yellow color themes.
    13 slides
    Pack of slides showing TAM, SAM, and SOM with definitions and a pie chart representing market segments in different layouts.
    1.9K+ views
    469 Downloads
    Get Custom Slides by Experts
    Instantly Access Templates in PowerPoint

    SAM vs TAM Presentation Slide

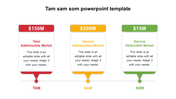
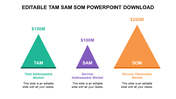
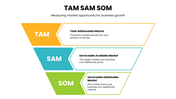
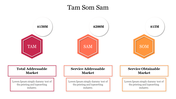
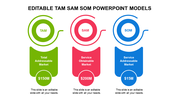
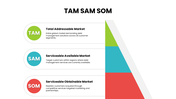
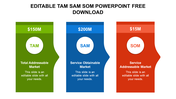
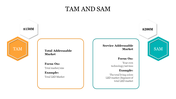
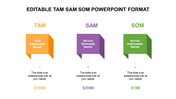
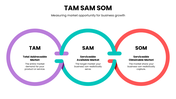
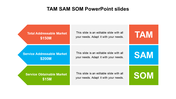
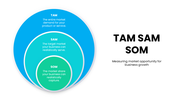
    SAM vs TAM is a crucial concept in business strategy and market research. SAM stands for Serviceable Available Market, and TAM stands for Total Addressable Market. Both SAM and TAM refer to the serviceable market that can be obtained. Understanding the difference between SAM and TAM is essential for businesses to make informed decisions about market entry, expansion, and resource allocation. Our funnel-shaped SAM vs TAM template simplifies this complex concept, helping you to identify your SAM and TAM and develop a more targeted and effective marketing strategy. Don't miss out on this valuable tool to optimize your business growth!


    Features of the template

    • 100% customizable slides and easy to download.
    • Slides are available in different nodes & colors.
    • The slide contains 16:9 and 4:3 formats.
    • Easy to change the colors of the slide quickly.
    • Well-crafted template with an instant download facility.
    • Highly compatible with PowerPoint and Google Slides.
    • Streamlined understanding of the process flow.
    • Essential knowledge for serviceable market.
    Advertisement

    You May Also Like These PowerPoint Templates

    Free
    Add to Wishlist
    Download
    AI Customize
    Slide illustrating TAM, SAM, and SOM concepts with labeled circles in orange, yellow, and blue each with caption area.
    Add to Wishlist
    Download
    AI Customize
    TAM, SAM, and SOM market size analysis template with green, blue, and orange diamond shapes with text area.
    Add to Wishlist
    Download
    AI Customize
    Colorful funnel diagram slide depicting TAM SAM SOM with financial data and descriptions for each market category.
    Add to Wishlist
    Download
    AI Customize
    TAM SAM SOM diagram in purple, red, and green sections, representing different market segments with caption areas in boxes.
    Add to Wishlist
    Download
    AI Customize
    Three horizontally aligned arrows in pink, blue, and orange, pointing right, each with corresponding text below.
    Add to Wishlist
    Download
    AI Customize
    Innovative Tam Sam Som Examples Presentation PowerPoint
    Add to Wishlist
    Download
    AI Customize
    Three concentric circles in varying shades of blue with corresponding labels and text on the right.
    Add to Wishlist
    Download
    AI Customize
    TAM, SAM, and SOM slide with three colored doughnut charts and placeholder text.
    Add to Wishlist
    Download
    AI Customize
    Three blocks in blue, yellow, and red, each with a label for TAM, SAM, and SOM with corresponding text underneath.
    Add to Wishlist
    Download
    AI Customize
    Colorful diagram illustrating the breakdown of market sizes for TAM, SAM, and SOM with corresponding financial figures.
    Add to Wishlist
    Download
    AI Customize
    Three labeled triangles representing tam, sam, and som with monetary values and market definitions.
    Add to Wishlist
    Download
    AI Customize
    Concentric circles in shades of purple, red, blue, and teal, showing levels of an addressable market, on a white backdrop.
    Add to Wishlist
    Download
    AI Customize
    Venn diagram with red, green, and blue circles labeled TAM, SAM, SOM, with corresponding text boxes around it.
    Add to Wishlist
    Download
    AI Customize
    PowerPoint template illustrating TAM, SAM, and SOM with sections and market size values in millions.
    Add to Wishlist
    Download
    AI Customize
    Three vertical pillars in blue, green, and orange representing TAM, SAM, and SOM concepts in a structured layout.
    Add to Wishlist
    Download
    AI Customize
    TAM SAM SOM template with three colored circular icons, each linked to placeholders text areas below with arrows.
    Add to Wishlist
    Download
    AI Customize
    TAM SAM SOM model slide showing Total Addressable Market, Service Addressable Market, and Service Obtainable Market.
    Free
    Add to Wishlist
    Download
    AI Customize
    Three colored rectangles in green, orange, and blue with white text bubbles and arrows pointing upward at the bottom.