Free - Simple Cycle Diagram PowerPoint Template and Google Slides

Free
Flowchart with five rectangular boxes in blue tones connected by arrows forming a sequential cycle diagram.
P.ID : 18451
    749 views
    223 Downloads
    Get Custom Slides by Experts
    Instantly Access Templates in PowerPoint

    Simple Cycle Diagram PowerPoint Template and Google Slides


    Revitalize your presentations with our Cycle Diagram PowerPoint template and Google Slides theme. In business, success often hinges on the ability to navigate through cyclic processes, ensuring continuous improvement and growth.

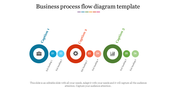
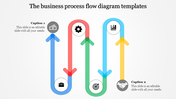
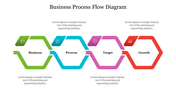
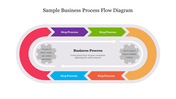
    Our template features a visually appealing cycle diagram, symbolizing the iterative nature of management and business operations. Each stage of the cycle is meticulously represented, providing a clear roadmap for organizational success.

    With its clean design and intuitive layout, our template empowers you to articulate complex concepts and strategies with ease. Whether you're discussing project management methodologies, product development lifecycles, or operational workflows, our template offers the flexibility and customization options you need to tailor your message to your audience.

    Enhance your presentations, streamline your message, and captivate your audience with our Cycle Diagram template. Download now and take your business presentations to the next level.

    Features of the template

    • 100% customizable slides and easy to download.
    • Slides are available in different nodes & colors.
    • The slide contains 16:9 and 4:3 formats.
    • It is easy to change the colors of the slide quickly. 
    • Well-crafted template with an instant download facility.
    • Highly compatible with PowerPoint, Google Slides and Canva templates
    Advertisement

    You May Also Like These PowerPoint Templates

    Add to Wishlist
    Download
    AI Customize
    Operations management slide illustrating five key elements with colorful interconnected icons with placeholder text.
    Add to Wishlist
    Download
    AI Customize
    Colorful flowchart showing interconnected boxes representing the Burke Litwin model, connected by arrows.
    Add to Wishlist
    Download
    AI Customize
    Circular flywheel diagram with four colored sections in orange, green, purple, and yellow, centered around customer icon.
    Add to Wishlist
    Download
    AI Customize
    Slide displaying the stages of product development with colorful icons and text captions.
    Free
    Add to Wishlist
    Download
    AI Customize
    Colorful circular process diagram slide featuring icons with text descriptions.
    Free
    Add to Wishlist
    Download
    AI Customize
    Colorful phased approach slide showing five phases from initiation to closing, with process steps below.
    Free
    Add to Wishlist
    Download
    AI Customize
    Slide with five circular icons in different colors, connected by arrows, representing product development steps.
    Add to Wishlist
    Download
    AI Customize
    Slide with five colored boxes in teal, red, orange, purple, and blue, each with icons and placeholder text.
    Free
    Add to Wishlist
    Download
    AI Customize
    A structured supply chain slide featuring four steps with icons for each stage.
    Add to Wishlist
    Download
    AI Customize
    Five colored square boxes, each with number and captions, linked by a dashed line.
    Free
    Add to Wishlist
    Download
    AI Customize
    Four rectangular shapes in blue outline with icons in curved arrows above and captions below.
    Add to Wishlist
    Download
    AI Customize
    A slide layout displaying essential elements for managing entity level controls, highlighted by vibrant colored icons.
    Add to Wishlist
    Download
    AI Customize
    Slide deck showcasing various process infographics in vibrant layouts, including flow charts and hexagonal designs.
    Add to Wishlist
    Download
    AI Customize
    Diagram illustrating a framework of grounded theory in four steps, with arrows connecting analysis processes and factors.
    Add to Wishlist
    Download
    AI Customize
    PowerPoint slide illustrating customer touch points, featuring a flowchart of six stages from commitment to loyalty.
    Add to Wishlist
    Download
    AI Customize
    Transition slide displaying five tracks with check marks, illustrating progress in a linear format.
    Add to Wishlist
    Download
    AI Customize
    Illustration of the butterfly life cycle showing stages from caterpillar, to adult butterfly on a floral background.
    Add to Wishlist
    Download
    AI Customize
    Belt conveyor process slide illustrates three key steps in the process with icons and placeholder text.
    Add to Wishlist
    Download
    AI Customize
    Colorful pie chart with eight numbered sections representing business buying steps, with labels around it.