100+ America Presentation Templates
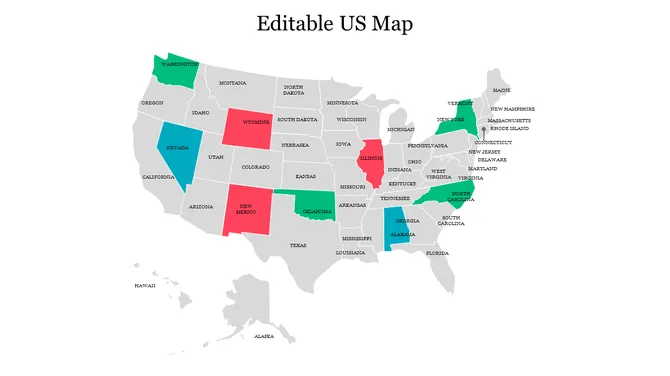
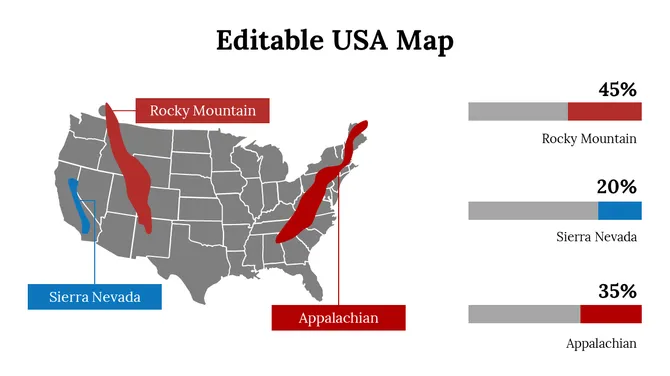
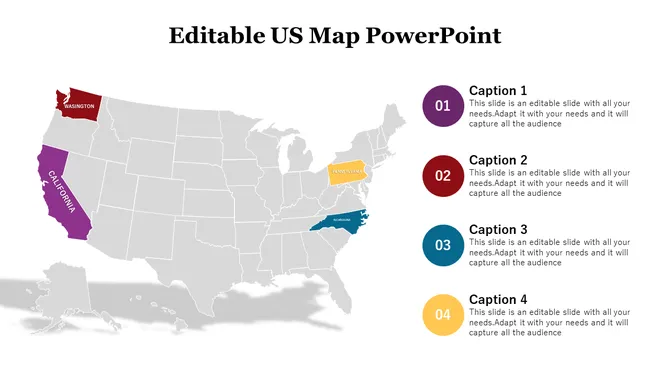
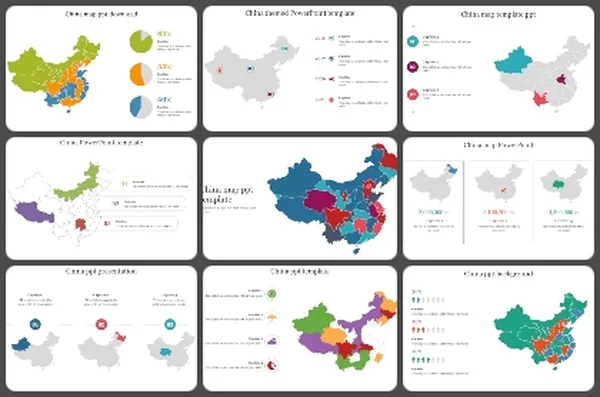
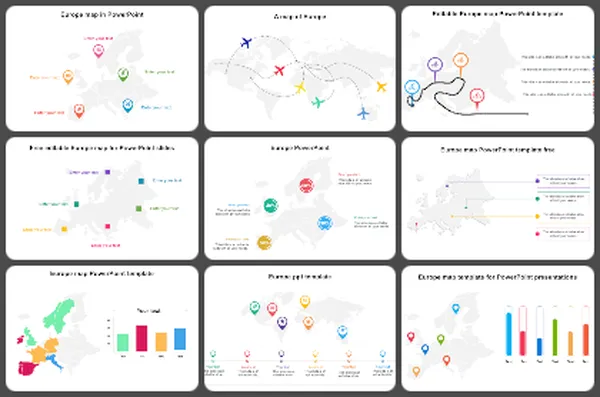
You're presenting something that happens across American states or regions geographically. Your audience needs to see where it happens. A map shows that geography. Numbers alone don't provide geographic context.
Editor's Choice (1 of5)


Explore the Wonders of the USA with Our Free America PowerPoint Templates and Google Slides Themes!
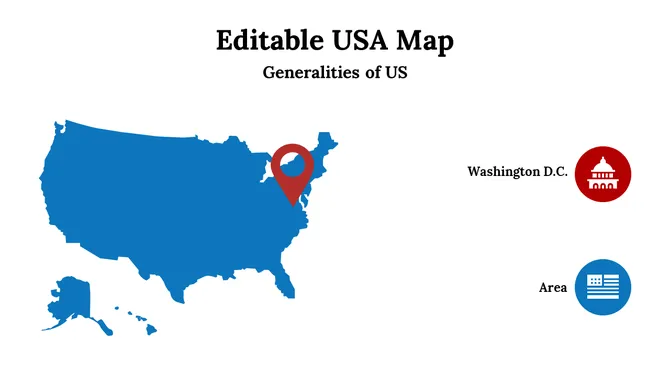
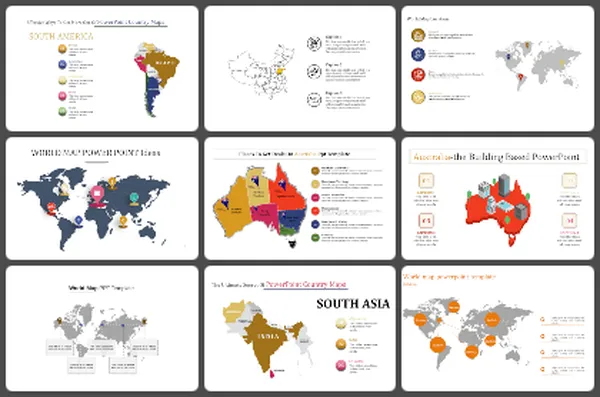
- Full Coverage: Our American PowerPoint templates cover the entire continent, from Canada's northern reaches to Chile's southernmost points.
- Clickable Parts: Some templates are interactive, making your presentation more interesting.
- Works Everywhere: Our templates work on PowerPoint and Google Slides.
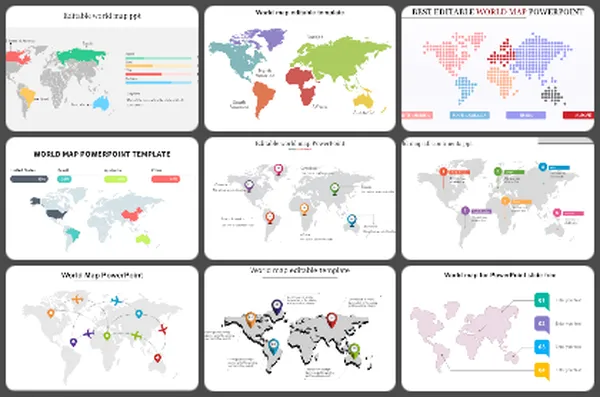
- Royalty-Free: You can use our United States PowerPoint templates without paying extra.
- Change Anything: You can edit our templates however you want.
- Different Shapes and Sizes: Our templates come in different shapes and sizes, so you can choose what works best for you.
- Free Slides: We also give you some slides for free.
Related Collections
Frequently Asked Questions
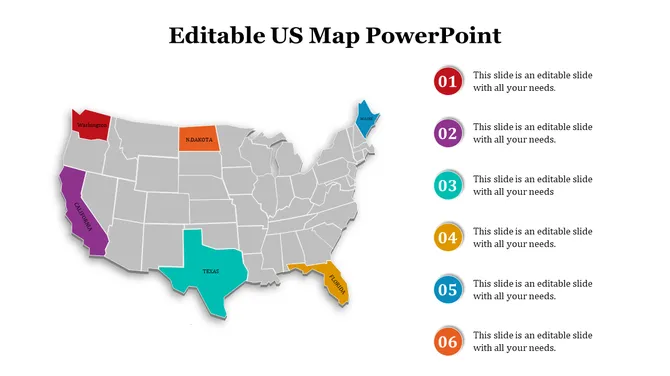
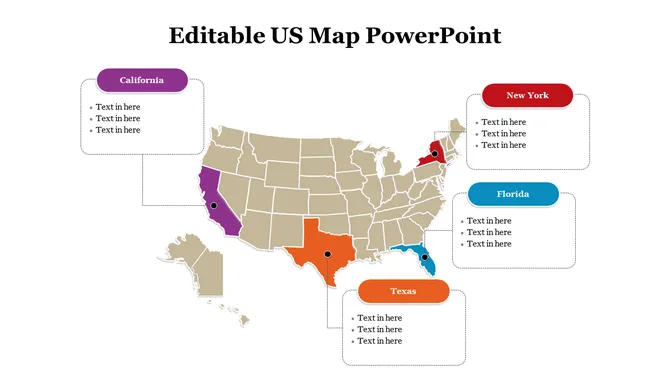
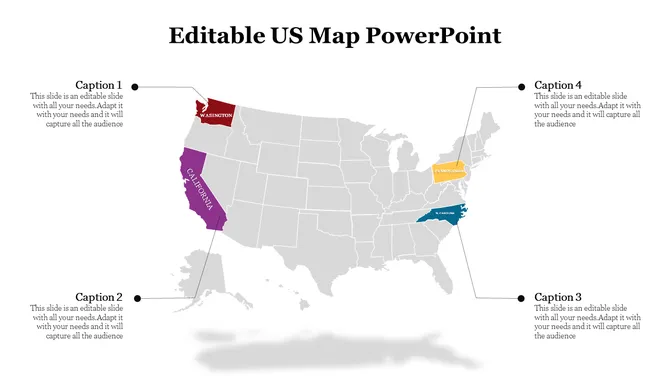
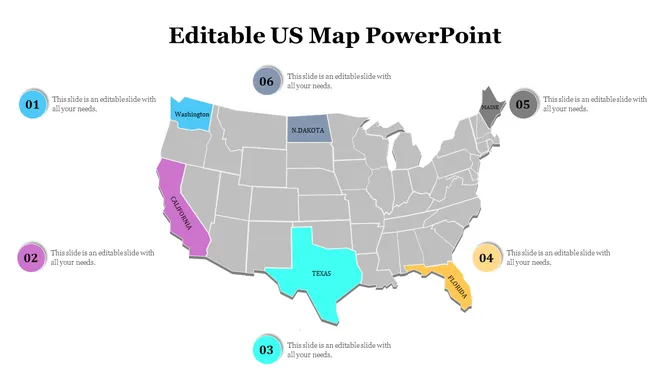
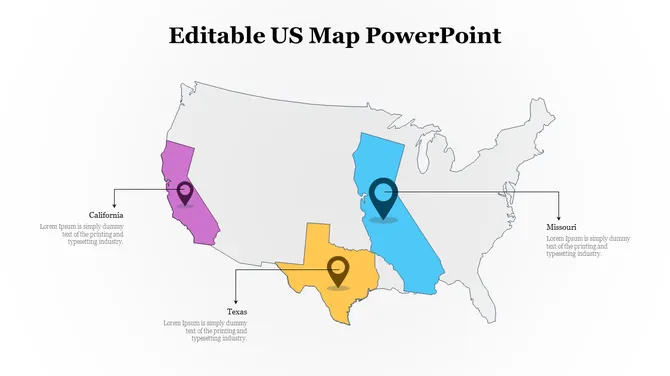
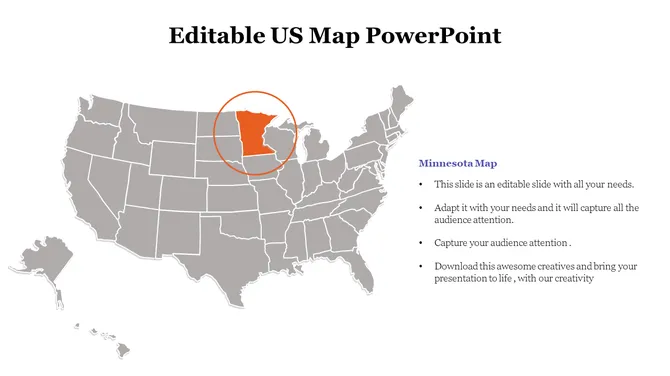
1. Can I highlight specific states to show which ones matter?
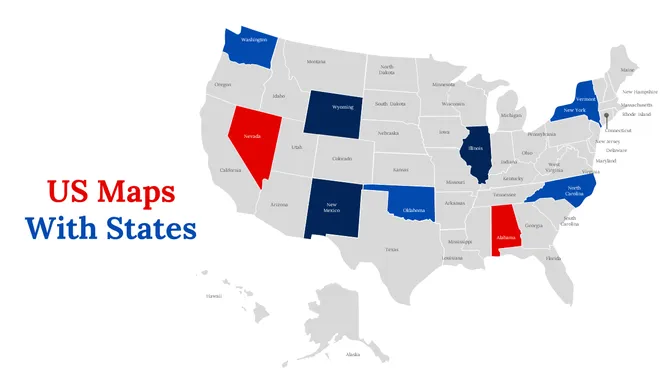
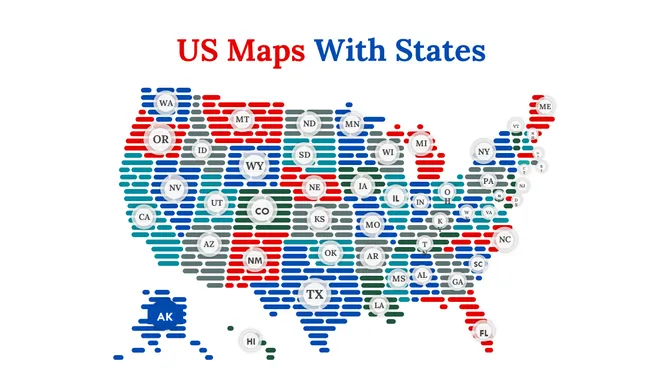
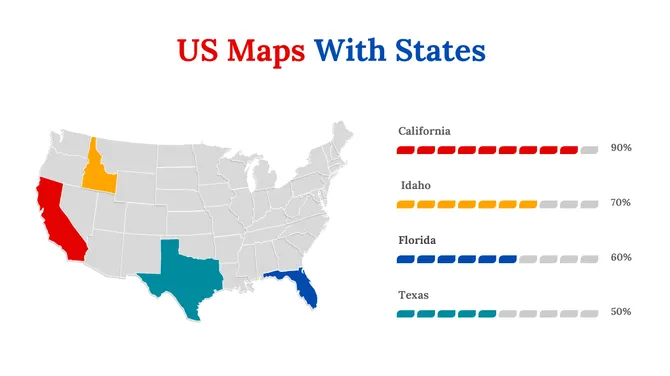
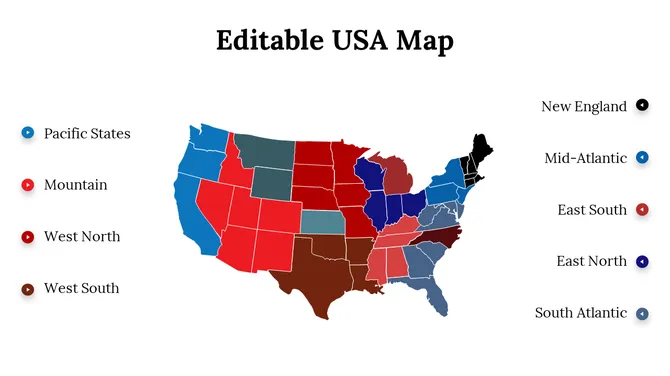
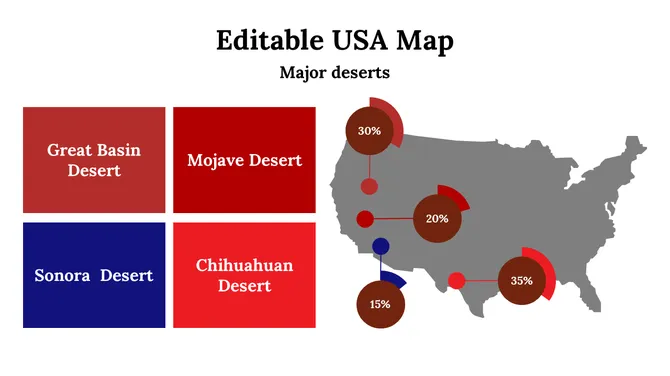
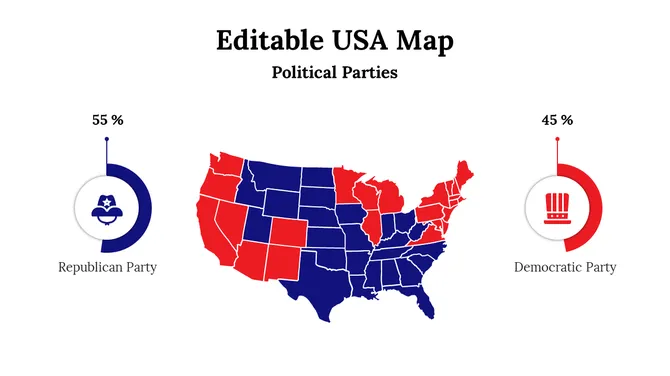
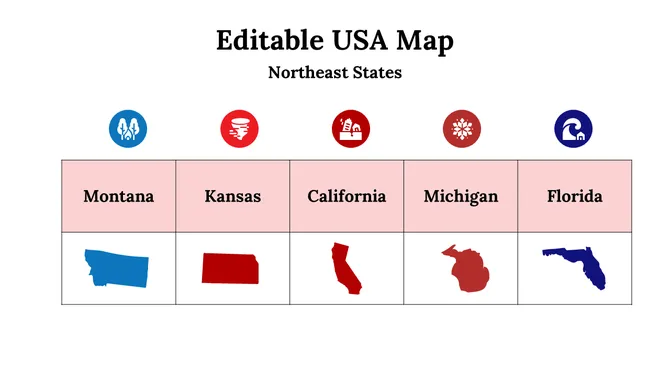
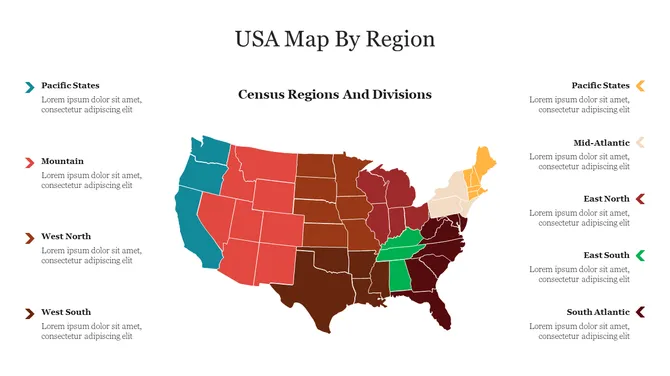
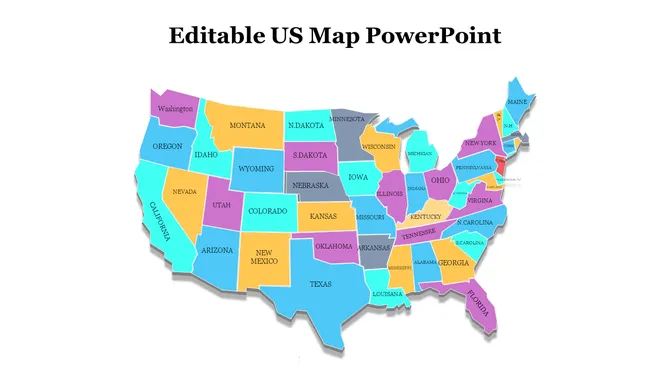
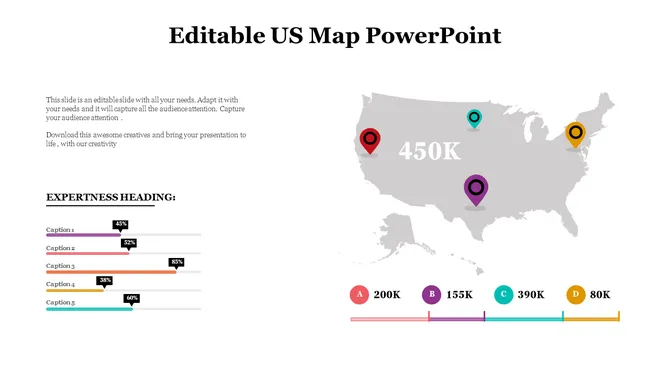
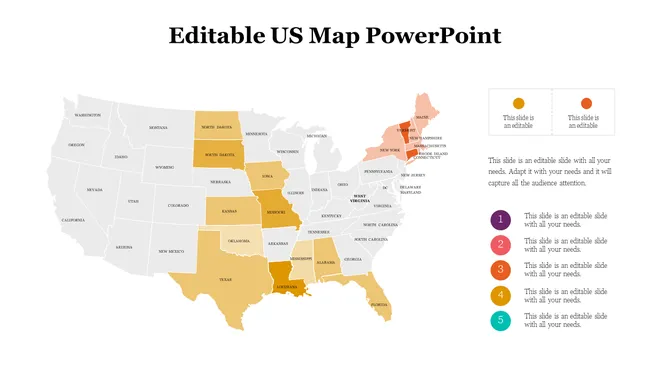
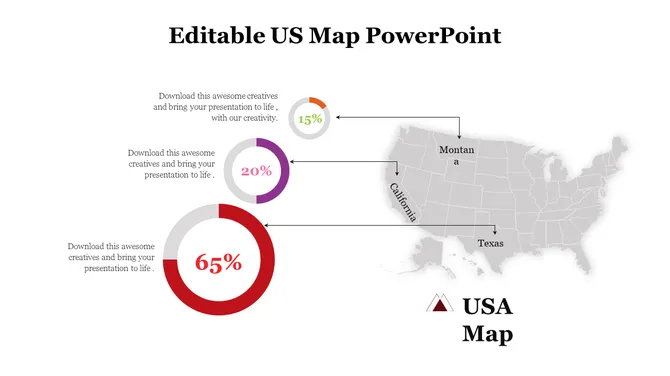
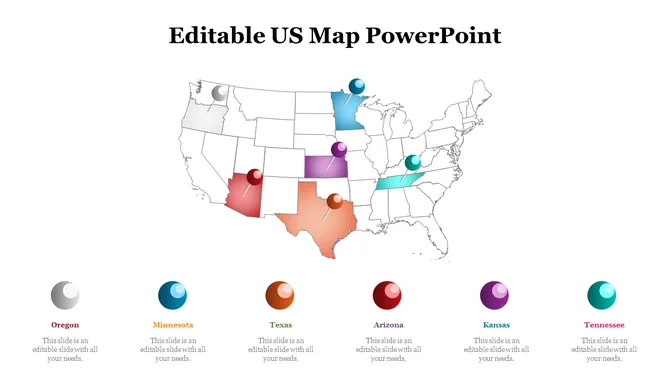
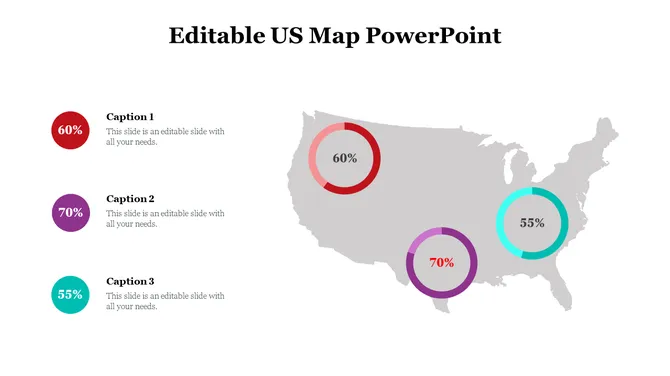
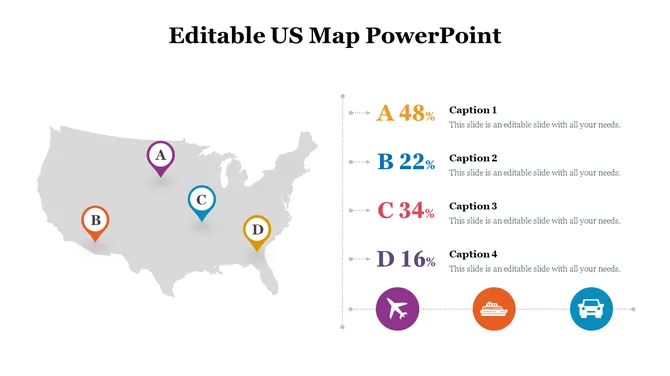
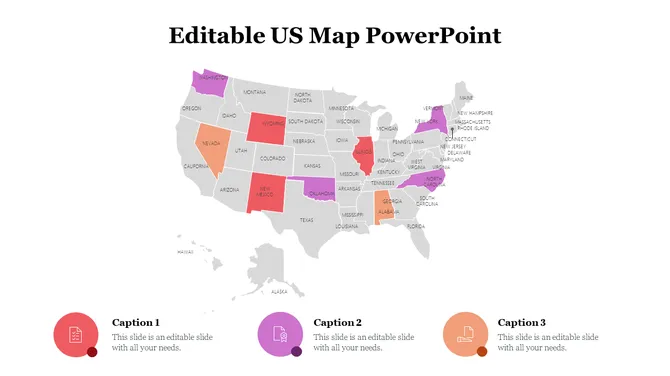
Yes. That's the whole point. You can color-code states, highlight specific ones, or shade regions differently. Your audience sees immediately which states are important to your message.
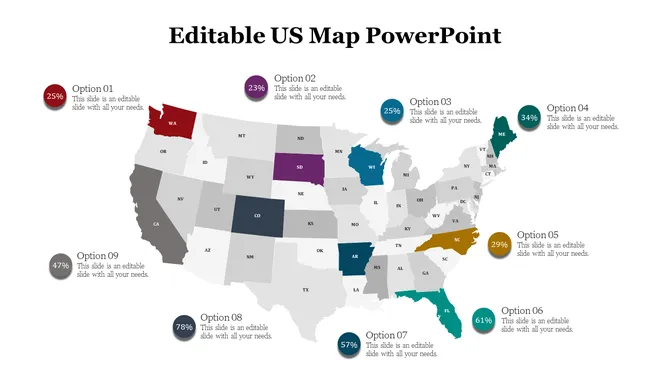
2. Can I show different data for different states on the same map?
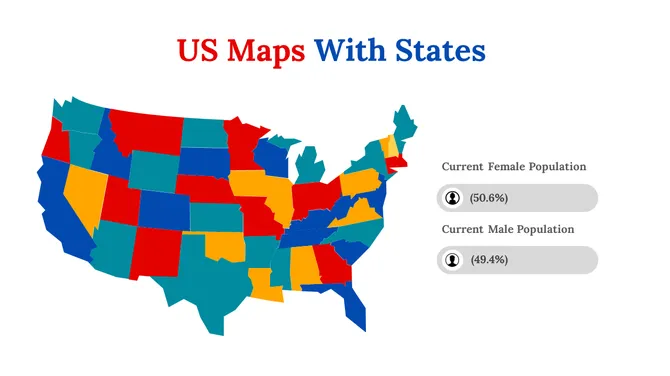
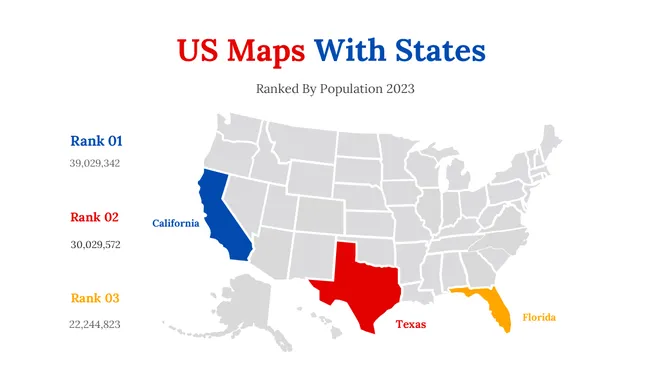
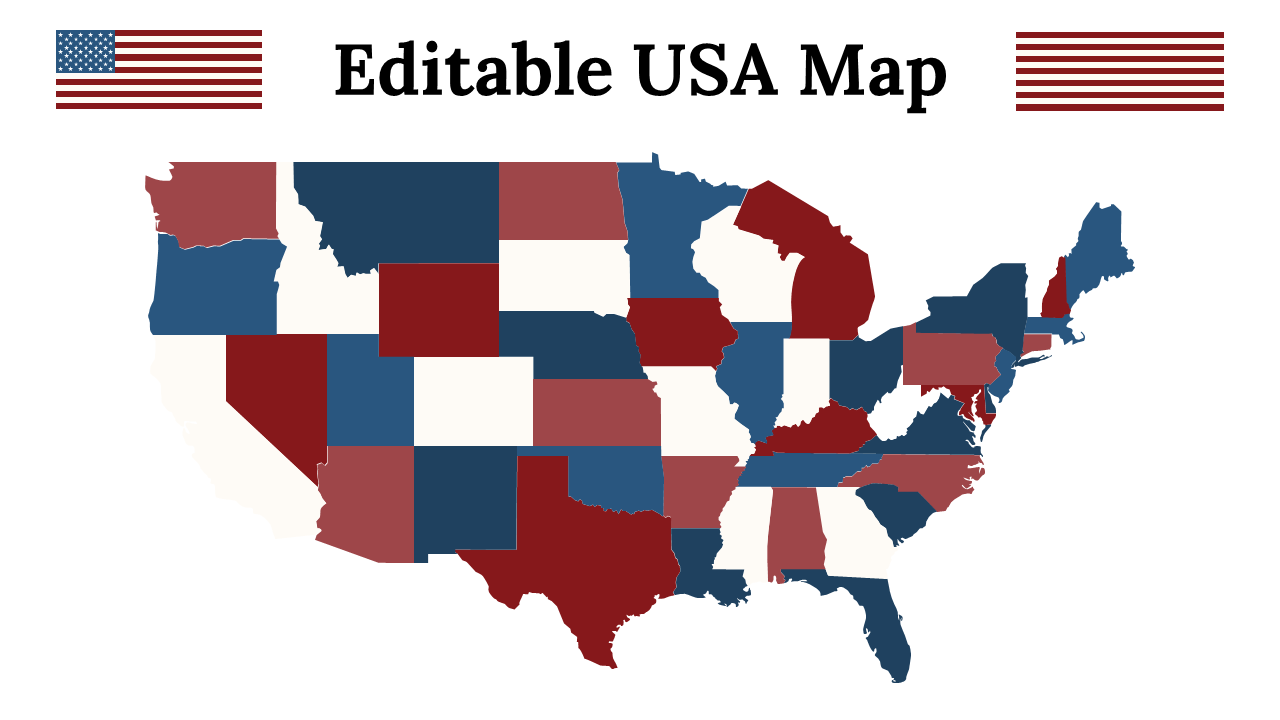
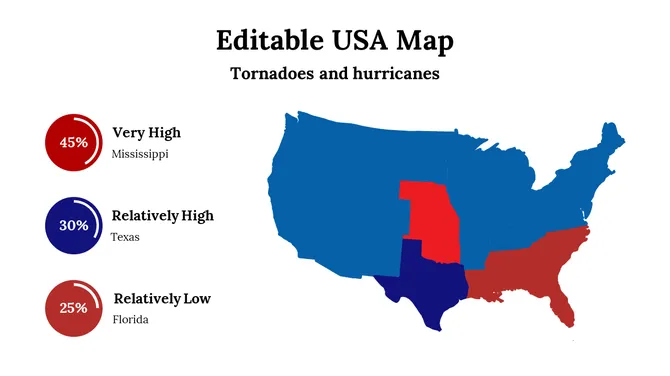
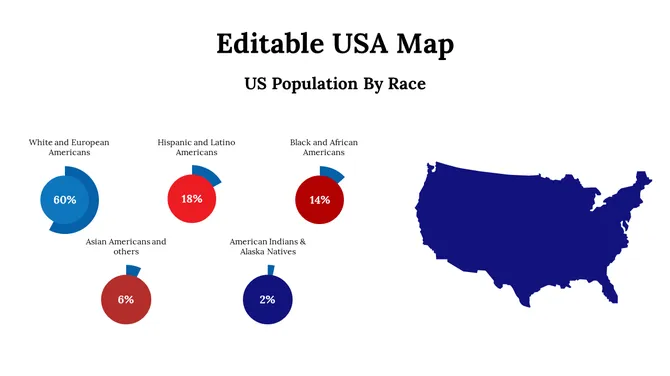
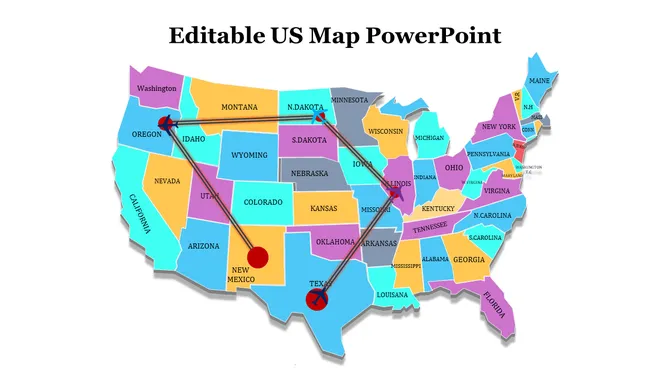
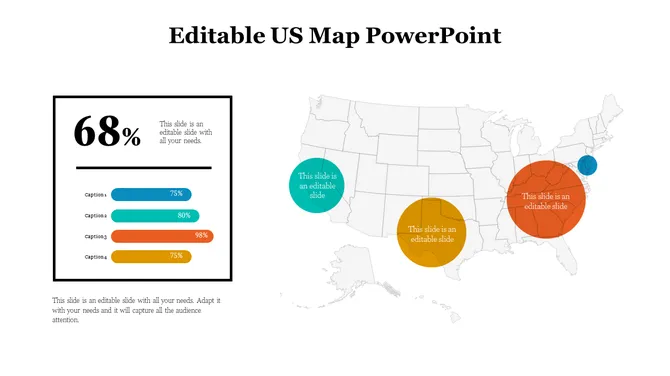
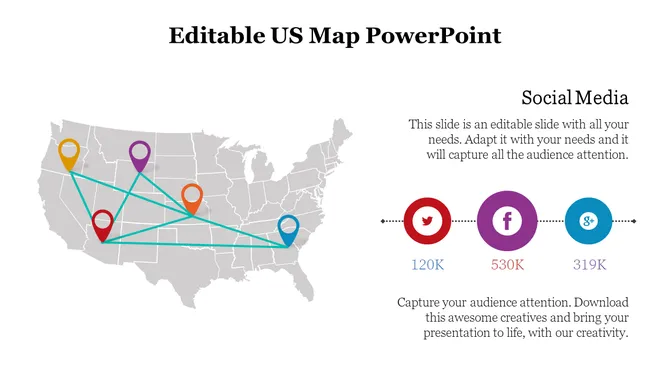
Yes. You can color-code by population, sales, growth, or any data that vary by state. Different colors show different values. Your audience sees the geographic pattern instantly.
3. What if I only need to show a few states, not the whole USA?
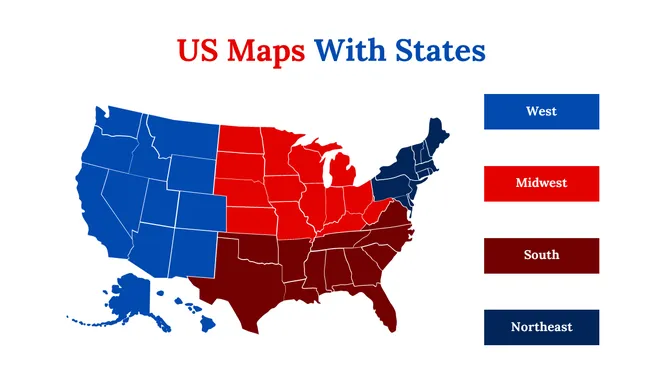
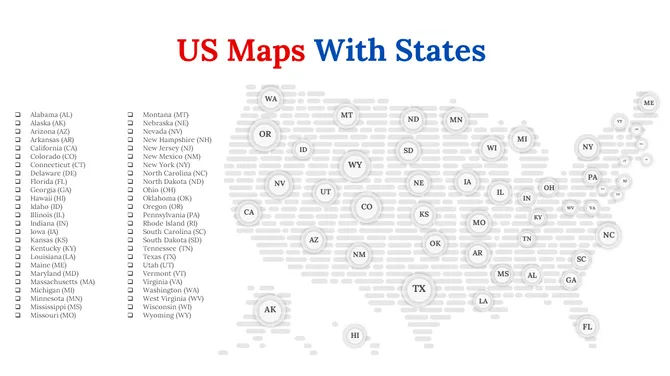
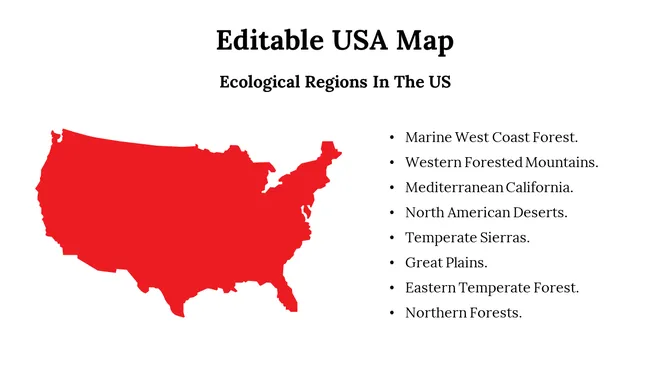
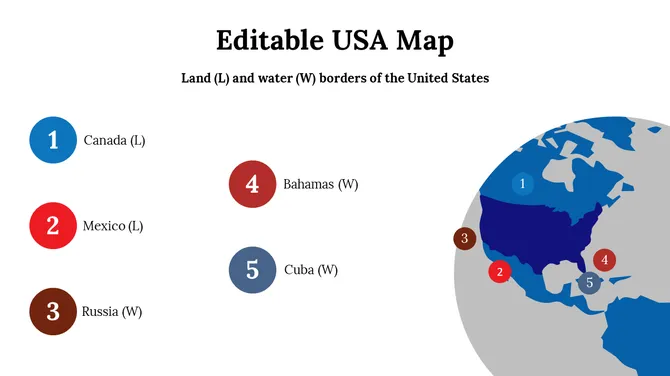
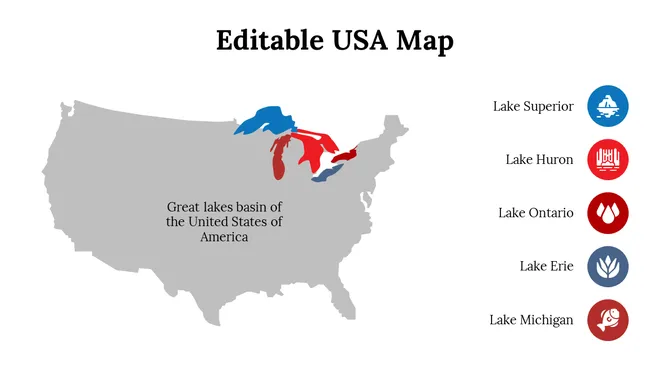
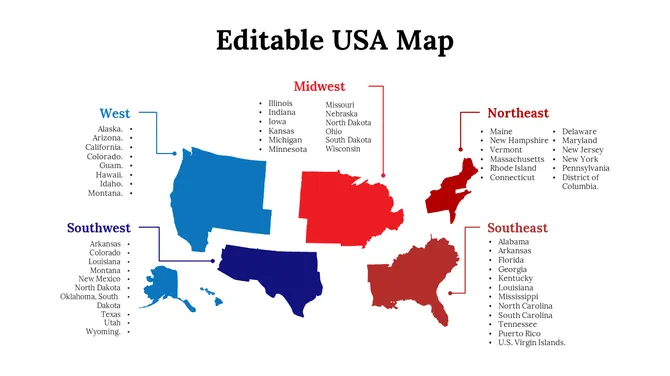
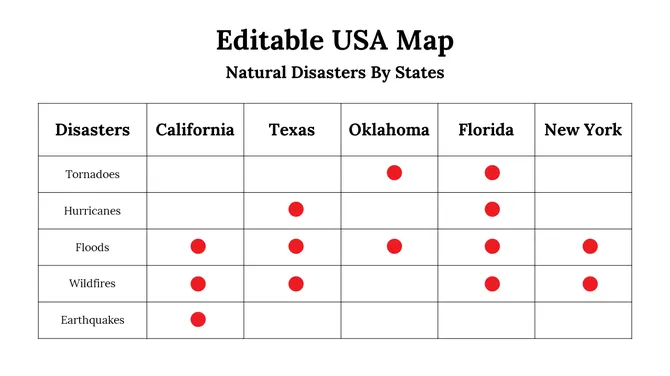
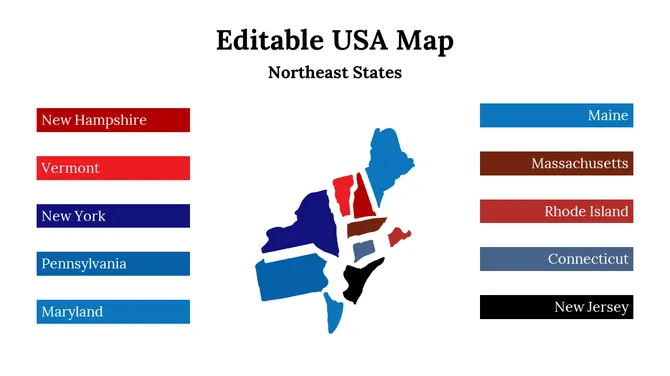
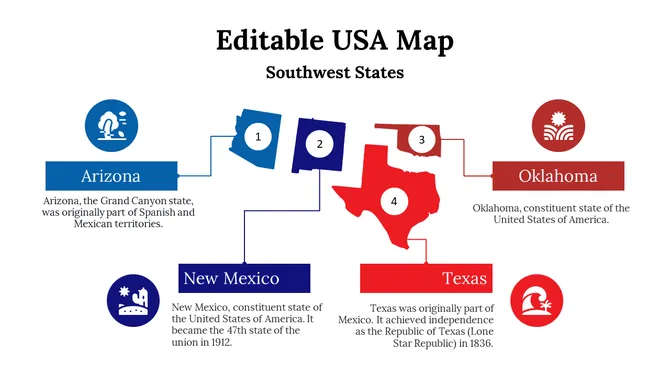
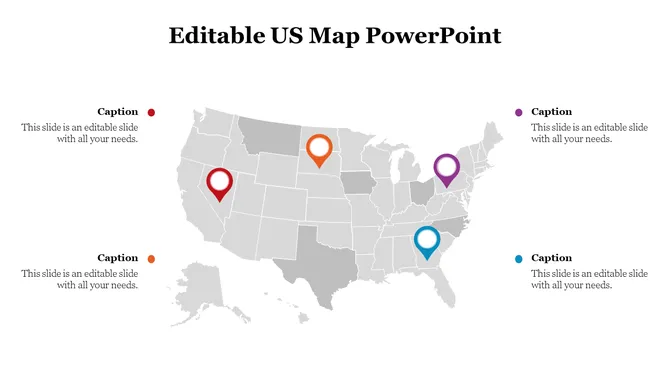
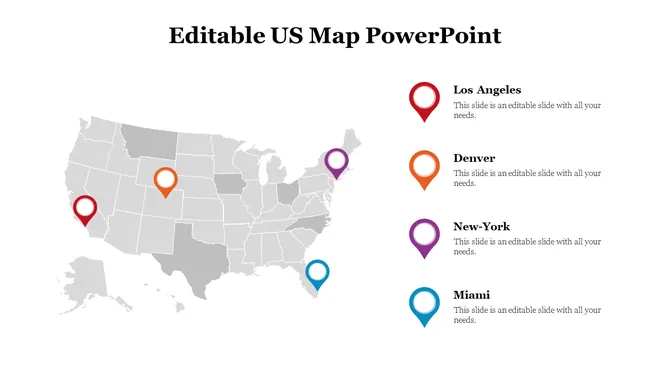
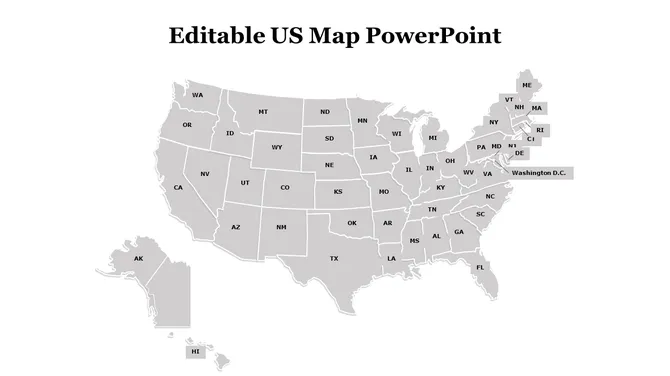
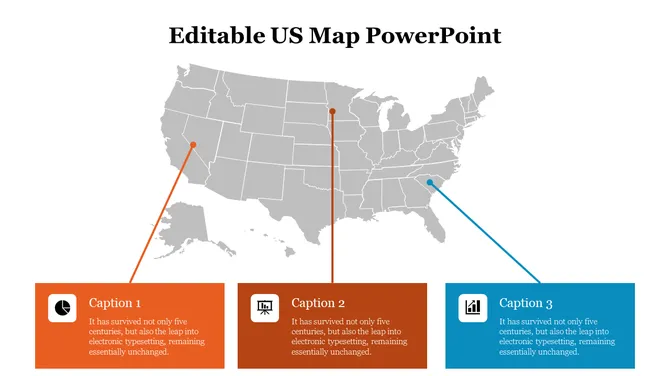
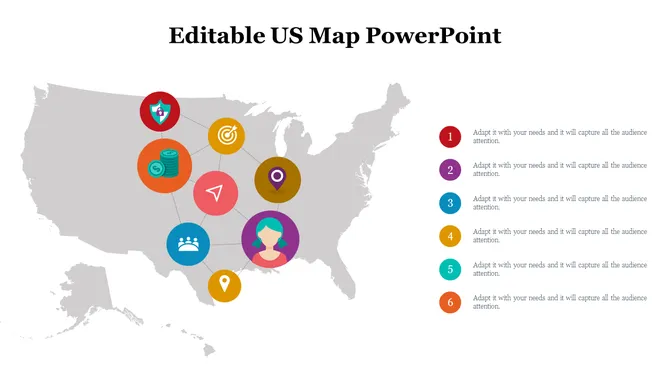
The map has all states. You can highlight the ones you need and leave others neutral. Or focus on specific regions like the Northeast or Southwest. It's flexible.
4. Can I add labels or information to each state?
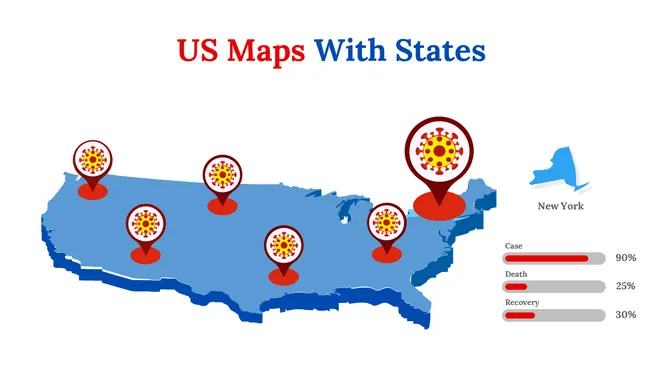
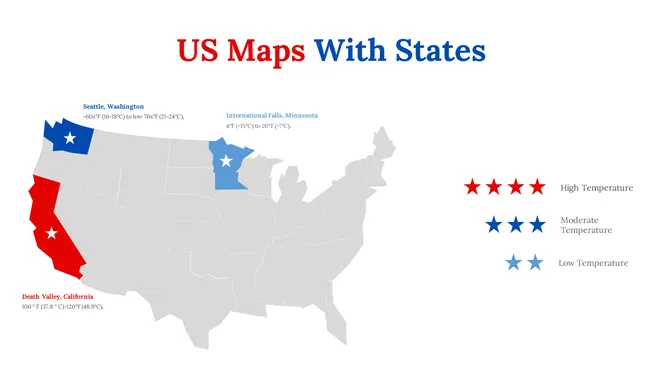
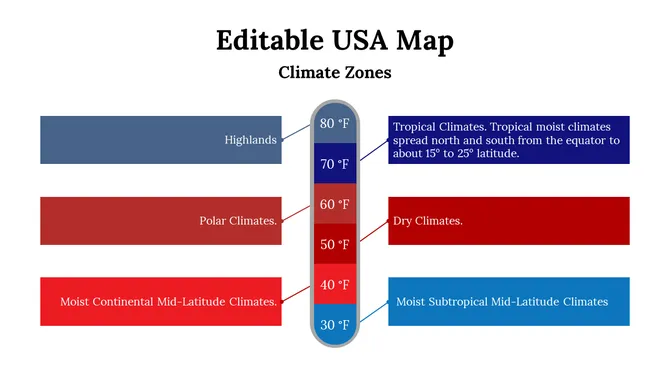
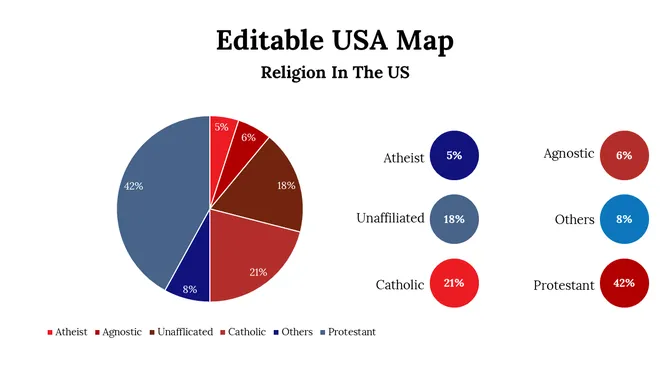
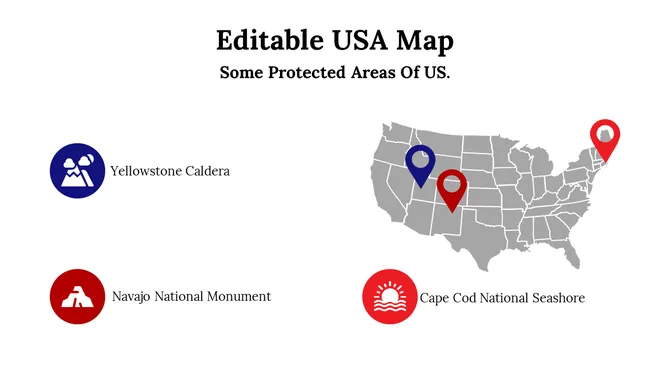
Yes. You can add numbers, percentages, region names, or any text. Each state becomes a data point. Your audience sees both the geographic location and the specific information.
5. Will this work for my regional or territorial breakdown?
Yes. Whether you manage sales territories, regional offices, or geographic zones, the map shows your geographic structure. Your team and audience understand the geography immediately.
6. Can I export this map to use in reports or presentations?
Yes. Export as PowerPoint, PDF, or image. The map looks professional in reports, presentations, and printed materials. Geography is clear no matter where you use it.
7. What if my data changes? Can I update the map easily?
Yes. Edit the colors, numbers, or highlights. Update the map as your data changes. It's flexible and editable. No need to rebuild from scratch.