Easy To Customize Finance Icons PPT And Google Slides
 Canva
Canva
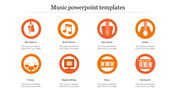
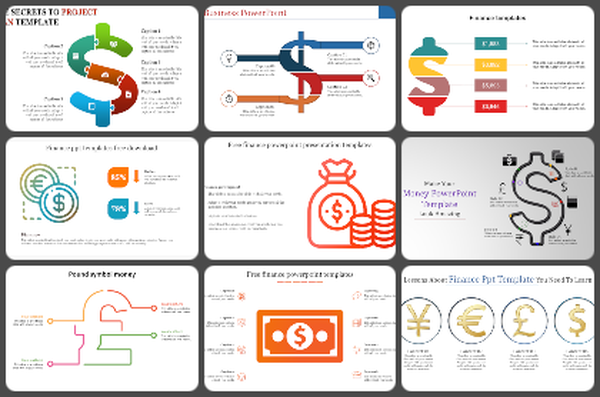
Finance Icons PowerPoint, Google Slides, and Canva Template
Finance icons are essential graphic tools used to represent financial data, economic trends, budgeting, and investment strategies in a visual, easy-to-understand format. From money symbols and charts to credit cards, bank buildings, savings, and stock market visuals, these icons help simplify complex financial topics. Whether you're presenting quarterly reports, startup pitch decks, or strategic investment plans, using clear and consistent finance icons enhances your presentation's readability and professional appeal.
Purpose Of The Slides
This slide is designed to elevate business and academic presentations by incorporating intuitive finance icons. These editable graphics help you highlight critical metrics such as profit growth, budgeting goals, ROI, cash flow, and financial performance with visual clarity. Each icon aligns with presentation design principles to ensure consistent visual storytelling.
Who Can Use It?
This deck is ideal for financial analysts, business consultants, students in finance, accountants, bankers, and startup founders. It's especially useful for creating budget plans, financial summaries, and investment presentations in both academic and professional settings.
Special Key Features
The slide pack includes multicolor, vector-based finance icons that are fully customizable. You can easily modify size, color, and orientation to match your theme. These icons support clean, infographic-style layouts and enhance data visualization in PowerPoint, Google Slides, and Canva.
Features of this template
- 100% customizable slides and easy to download.
- The slides contain 16:9 and 4:3 formats.
- Easy to change the colors quickly.
- Highly compatible with PowerPoint, Google Slides, and Canva templates.
You May Also Like These PowerPoint Templates

