Effective Ways To Analysis PPT Template and Google Slides

Green oval icons with white circular symbols and shadow effects arranged in two rows each with placeholder text areas.
P.ID : 27336
    105 views
    1 Downloads
    Get Custom Slides by Experts
    Instantly Access Templates in PowerPoint

    Analysis PowerPoint Template 


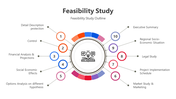
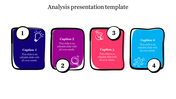
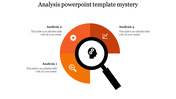
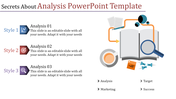
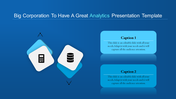
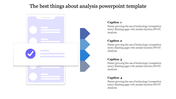
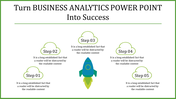
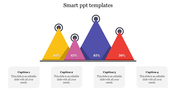
    Our Effective Ways to analyse PowerPoint templates make evaluating data a breeze. They're designed to make complex information easy to understand and look great too. With a sleek, modern design, you can present your findings clearly and impressively. Each template features four green circles, each with its icon and space for your text. This structure helps you organize your data logically and catch your audience's eye.

    It is well-defined sections or placeholders for different types of data that help organize your analysis effectively. You can even customize the colors and icons to match your style. Whether you're a pro presenting market research, a student sharing project data, or a teacher explaining stats, these templates are perfect. They'll help you create presentations that inform and impress without the stress. Download them now in Google Slides and make your data shine!

    Features of the template:


    • Slides are available in different nodes & colors.
    • Easy to change the slide colors.
    • Well-crafted template with instant download.
    Advertisement

    You May Also Like These PowerPoint Templates

    Add to Wishlist
    Download
    AI Customize
    Slide featuring a five step process for performance with matching icons for each phase.
    Free
    Add to Wishlist
    Download
    AI Customize
    Analysis presentation template with six sections arranged in a yellow circle, each featuring an icon and caption.
    Add to Wishlist
    Download
    AI Customize
    Analysis PowerPoint slide featuring a hexagonal internal analysis core and six colorful surrounding icons with labels.
    Add to Wishlist
    Download
    AI Customize
    Colorful pie chart with a man holding a pencil, surrounded by directional arrows, symbolizing analysis and decision making.
    Add to Wishlist
    Download
    AI Customize
    Slide deck featuring multiple analysis templates with colorful layouts, charts, and icons for data representation.
    Add to Wishlist
    Download
    AI Customize
    Performance template with four linked circles labeled from finance to business processes, each with bullet points and icons.
    Add to Wishlist
    Download
    AI Customize
    Colorful circular analysis template featuring six sections with icons growth, target, people, settings, data, and analytics.
    Add to Wishlist
    Download
    AI Customize
    Blue infographic with location pins displaying percentages for market analysis, arranged in a triangular layout.
    Add to Wishlist
    Download
    AI Customize
    Business growth analysis slide featuring a cartoon character with a telescope showing a bar chart, and four captions.
    Add to Wishlist
    Download
    AI Customize
    Situation analysis PPT slide featuring icons for industry research and firm capabilities with captions in two colored boxes.
    Add to Wishlist
    Download
    AI Customize
    Bar graph in multiple colors showing evolution over years, with a human figure and three text boxes on the right.
    Add to Wishlist
    Download
    AI Customize
    Innovative Current Situation PowerPoint And Google Slides
    Add to Wishlist
    Download
    AI Customize
    Best Target Operation Model PowerPoint Presentation
    Add to Wishlist
    Download
    AI Customize
    Pack of slides with colorful icons and sections for various data analysis, including visuals and layouts.
    Free
    Add to Wishlist
    Download
    AI Customize
    Analysis PowerPoint slide featuring a bar graph and vehicle icons with placeholders for text and subheadings.
    Free
    Add to Wishlist
    Download
    AI Customize
    Analysis slide with six segmented circular progress charts in gray and orange, each linked by gray bars and labeled below.
    Free
    Add to Wishlist
    Download
    AI Customize
    Analysis PowerPoint slide showcasing a target with an arrow, a chart, and a message box with caption text.
    Add to Wishlist
    Download
    AI Customize
    Performance slide with four quadrants in red, green, teal, and blue, connected in a circular flow with relevant text.
    Free
    Add to Wishlist
    Download
    AI Customize
    Grayscale process flow diagram with three horizontal arrows, numbered 01 to 03, showing analysis steps.