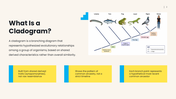
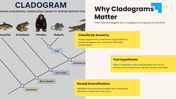
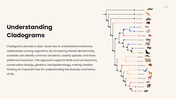
Students almost always get one thing wrong the first time they see a cladogram: they read it left to right like a ladder, assuming the species on the right are "more evolved." This template exists specifically to correct that instinct before it sets in. It opens with a precise definition — a cladogram groups organisms by shared derived traits, not surface resemblance, and every branch point marks a hypothesized common ancestor rather than a point in literal time. Browse more biology powerpoint templates to round out your life sciences presentation.
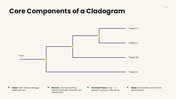
From there it builds the vocabulary and structure a student actually needs to read one correctly: nodes, branches, terminal taxa, and clades, followed by a full construction walkthrough — selecting taxa and characters, distinguishing ancestral from derived trait states, grouping by shared synapomorphies, and applying parsimony to build the simplest tree the evidence supports. A terminology slide locks down the words that trip people up most: synapomorphy, monophyletic group, outgroup, and ancestral trait.
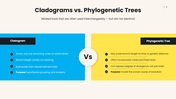
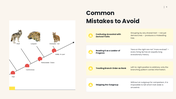
The most useful slide in the set may be the one dedicated entirely to what a cladogram is not — it's directly compared against a phylogenetic tree, since the two get used interchangeably despite real differences in what branch length means and how each is built. A common-mistakes slide follows immediately after, tackling the ladder-of-progress misreading head-on along with the temptation to group by any shared trait instead of specifically derived ones. A closing slide ties the whole method back to where it actually gets used — taxonomy, conservation biology, genetics, and epidemiology.
Built for biology teachers, evolutionary biology courses, science museums, and textbook publishers who need students to walk away reading these diagrams correctly, not just recognizing the shape. Every taxon, term, and diagram is yours to edit.






 Canva
Canva