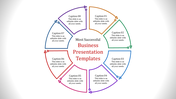
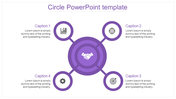
Circular Organizational Chart Template for Structure


Pie Chart Presentation Template
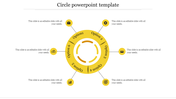
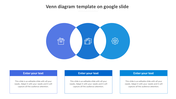
Transform your data into compelling visuals with our Pie Chart Presentation Slide. This user-friendly pie chart features three sections, each with a title, description, and visually engaging icon. Perfect for representing data across three distinct categories, the sections allow for easy comparison, while the icons provide a visual representation of each category.
Effortlessly customizable, simply add your data to the text boxes and adjust the colors of the sections and icons to align with your brand. This pie chart serves as an effective tool for visually presenting information in presentations, reports, and marketing materials.
Elevate your data representation game. Download our Pie Chart Presentation Slide now and make your information visually impactful. Click to enhance your presentations and reports!
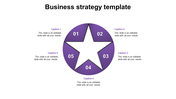
Features of the template:
- Slides are available in different nodes & colors.
- Easy to change the slide colors.
- 100 % customizable slides and easy to download.
- Well-crafted template with instant download.


You May Also Like These PowerPoint Templates
Add to Wishlist
Download
Edit

Add to Wishlist
Download
Edit


Add to Wishlist
Download
Edit

Add to Wishlist
Download
Edit

Add to Wishlist
Download
Edit


Add to Wishlist
Download
Edit

Add to Wishlist
Download
Edit


Add to Wishlist
Download
Edit

Add to Wishlist
Download
Edit


