Growth Analysis Circle Infographic PowerPoint Presentation
Free
Nodes

Colors
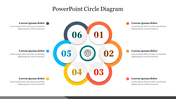
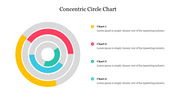
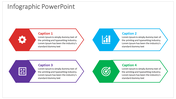
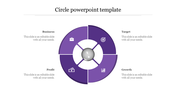
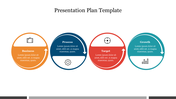
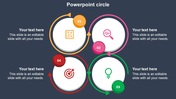
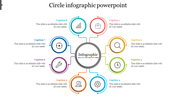
Growth Analysis Presentations with our Circle and Model Presentation
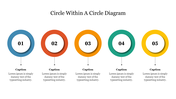
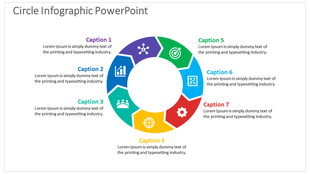
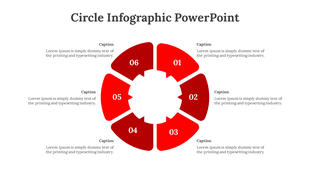
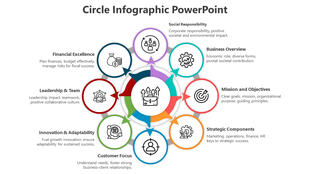
Revolutionize your growth analysis presentations with our Circle and Model Presentation Template. Featuring five content holders, this infographic brings data to life with distinctive percentage markers and separate text spaces for clarity.
Perfect for professionals across industries, this template simplifies complex growth data, making it accessible and impactful. Business analysts, strategists, and financial experts can seamlessly communicate insights to diverse audiences.
Download now for a powerful presentation experience. Make your data speak volumes and captivate your audience effortlessly. The Growth Analysis Circle and Model Presentation Template
Features of the Template
- 100 % customizable slides.
- The slide show is in 4:3, 16:9, zip format.
- There is powerful connectivity with PowerPoint Templates.
- It is simple and quick to alter the slide's color.
- An efficient template that can be easily accessed immediately.
- Well-crafted template with an instant download facility.
More Collections for Growth Analysis Circle Infographic PowerPoint
Recommended based on this template.
Similar Templates to Growth Analysis Circle Infographic PowerPoint
Showing20 of69,218 templates