Advanced Business Process PPT Template for Solutions

 Canva
Canva
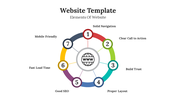
Business Process PPT Template and Google Slides
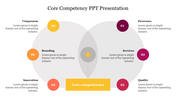
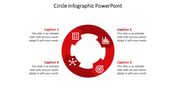
The "Business Process PPT Template and Google Slides" is a visual aid designed to illustrate and explain various aspects of a business process. The image features a circular diagram divided into 8 sections, each labeled with key components of the process: "Customer", "Scope", "Purpose", "Steps", "Process", "Sequence", "Operators", and "Outcome".
This template is ideal for professionals across industries who need to present or analyze business processes. It can be used by project managers, business analysts, consultants, and team leaders to document, analyze, and communicate business processes effectively.
Compatibility with PowerPoint and Google Slides. Available in 16:9 and 4:3 aspect ratios, catering to different screen sizes and presentation preferences. Provided in ZIP format for easy sharing and distribution. Free template with 100% customizable features. Download now.


You May Also Like These PowerPoint Templates
Add to Wishlist
Download
AI Customize


Free
Add to Wishlist
Download
AI Customize

Add to Wishlist
Download
AI Customize


Add to Wishlist
Download
AI Customize

Add to Wishlist
Download
AI Customize

Add to Wishlist
Download
AI Customize

Add to Wishlist
Download
AI Customize

Add to Wishlist
Download
AI Customize

Add to Wishlist
Download
AI Customize

Add to Wishlist
Download
AI Customize

Add to Wishlist
Download
AI Customize


Add to Wishlist
Download
AI Customize

Add to Wishlist
Download
AI Customize

Add to Wishlist
Download
AI Customize


Add to Wishlist
Download
AI Customize
