Detailed Business PowerPoint Template for Strategic Planning


Arrow Model Business Presentation Template
It's not that tough to create a business presentation. It is a simple process with our pre-designed Business PowerPoint Template and Google Slides empowers you to create visually stunning business presentations in a minute.
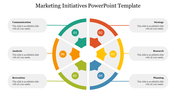
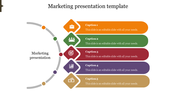
This creative slide features a modern arrow diagram. The use of clean lines, striking icons, and shades of violet creates a professional and engaging layout. Years or milestones are prominently displayed alongside each arrow, providing a clear timeline for your presentation. The plain background is the key to your information.
Give a try to our well-designed business PowerPoint template. Download now and achieve your business presentation goals with ease.
Features of the template:
- Easy to change the slide colors.
- 100 % customizable slides and easy to download.
- Well-crafted template with instant download.


You May Also Like These PowerPoint Templates
Add to Wishlist
Download
Edit


Add to Wishlist
Download
Edit

Add to Wishlist
Download
Edit


Add to Wishlist
Download
Edit

Add to Wishlist
Download
Edit

Add to Wishlist
Download
Edit


Add to Wishlist
Download
Edit

Add to Wishlist
Download
Edit

Add to Wishlist
Download
Edit

Add to Wishlist
Download
Edit

Free
Add to Wishlist
Download
Edit


