Stunning Analysis PowerPoint Template-Orange Color

Analysis PPT slide with five orange labeled sections including Job, Semen, SWOT, Data, and Philosophical with icons.
P.ID : 26694
    13 slides
    Grid of various plot diagram slides showcasing narrative arcs, with labels for different stages of a plot's progression.
    13 slides
    Slide deck showcasing ratio analysis elements with colorful geometric designs and icons, highlighting financial metrics.
    11 slides
    Slide deck covering hypothesis testing, with a central six-step process diagram and supporting slides in a white background.
    11 slides
    Flowchart with icons representing predictive analytics elements below with detail analytics processes and value chains.
    13 slides
    3C analysis slides with various triangle shaped layouts in vibrant colors representing company, customers, and competitors.
    114 views
    1 Downloads
    Get Custom Slides by Experts
    Instantly Access Templates in PowerPoint

    Analyze With Precision: Analysis PowerPoint Template


    The need to shape a range of different types of information cannot be overviewed without discussion of the Analysis PowerPoint templates as well.
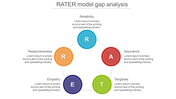
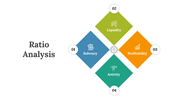
    Slide Description:

    • Five orange-colored oval-shaped nodes
    • Every node containing the icon and title
    • Titles: job, semen, data, SWOT, messy.
    • Text boxes that can be activated for adding more specific content.

    Who Can Benefit?

    This template is most suitable for business analysts, researchers, educators, and any corporate employee who has to present information and its analysis in a simple and easy-to-understand way.

    Purpose of the Slide:

    This slide aims to support you by presenting different forms of the analysis in a logical structure. Different analytical perspectives can be presented through the help of nodes with distinctive appearances.

    Download now

    Features of the template


    • 100% customizable slides and easy to download.
    • The slides contain 16:9 and 4:3 formats.
    • Easy to change the colors quickly.
    • It is a well-crafted template with an instant download facility.
    • It is a 100% pre-designed slide.
    • The slide holds vibrant colors.
    Advertisement

    You May Also Like These PowerPoint Templates

    Add to Wishlist
    Download
    AI Customize
    Feasibility Analysis Template Design Presentation Slide
    Add to Wishlist
    Download
    AI Customize
    Curved arrow stack analysis diagram with various icons and colors representing stages.
    Add to Wishlist
    Download
    AI Customize
    Four tear drop quadrants in blue, orange, green, and yellow, each with circular accents, representing moscow analysis.
    Add to Wishlist
    Download
    AI Customize
    Pareto Analysis PowerPoint And Google Slides Template
    Add to Wishlist
    Download
    AI Customize
    Job analysis table with colorful sections in red, green, yellow, blue, and teal, displaying details and requirements
    Add to Wishlist
    Download
    AI Customize
    Data analysis slides with flowcharts, icons, and colored segments for statistical methods and machine learning algorithms.
    Add to Wishlist
    Download
    AI Customize
    Four stacked, tilted rectangles in purple, blue, green, and red, each showing steps in hazard analysis and risk assessment.
    Add to Wishlist
    Download
    AI Customize
    GROW Coaching Model PPT Presentation And Google Slides
    Add to Wishlist
    Download
    AI Customize
    Lead time analysis PPT slide illustrating the process with three key elements and icons.
    Add to Wishlist
    Download
    AI Customize
    The research methodology slide features a central magnifying glass connected by six colorful icons with text area.
    Add to Wishlist
    Download
    AI Customize
    Collection of slides showing different styles like diamonds, hexagons, and flowcharts, with ethical principles.
    Add to Wishlist
    Download
    AI Customize
    Slide with five numbered colorful arrows with text area on the left, and a pie chart highlighting observation
    Add to Wishlist
    Download
    AI Customize
    A structured 8D analysis slide featuring eight distinct steps, each labeled with a numbered blue bar.
    Free
    Add to Wishlist
    Download
    AI Customize
    Slide pack showing a cost benefit analysis with a scale balancing costs and benefits, using colorful charts and diagrams.