300+ Matrix Presentation Templates

You're evaluating multiple options against multiple criteria, but without a visual framework, it's all opinion and debate. Teams get stuck. Progress halts. A matrix shows how each option scores objectively across criteria, making decisions clear and defensible.
Free
Add to Wishlist Download Edit
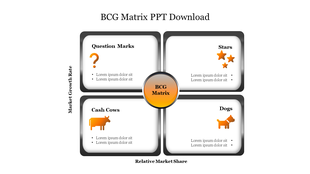
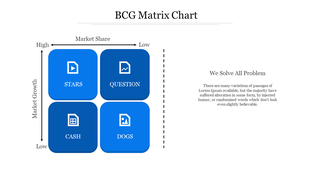
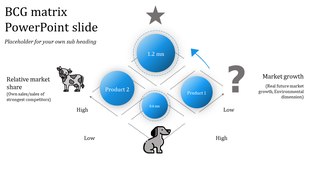
Slide displaying a BCG Matrix with labeled quadrants in multi colour, with descriptions of each product type.
Free
Add to Wishlist Download Edit
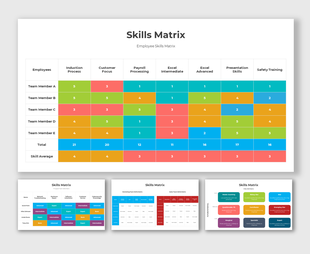
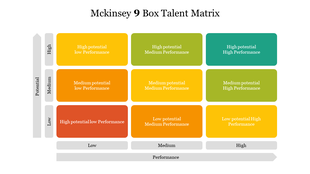
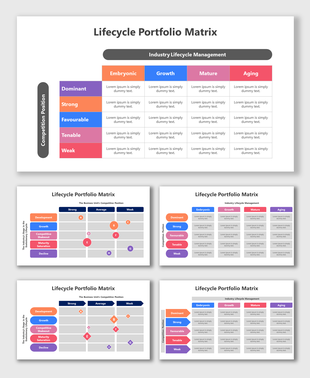
Slide deck featuring a colorful skills matrix, with rows and columns, showing proficiency levels with color codes.
Free
Add to Wishlist Download Edit
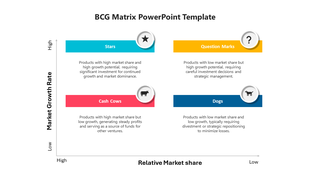
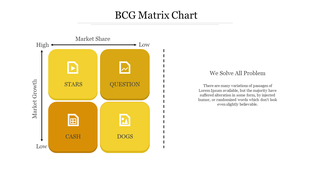
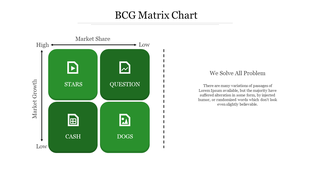
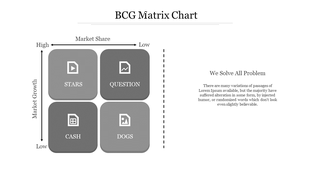
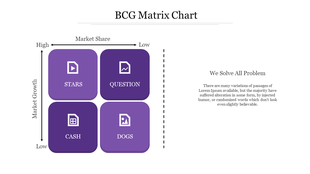
BCG Matrix chart showing four quadrants Stars, Question, Cash, and Dogs with icons representing each category.
Free
Add to Wishlist Download Edit
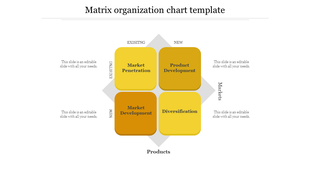
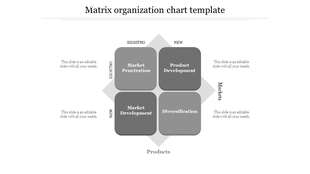
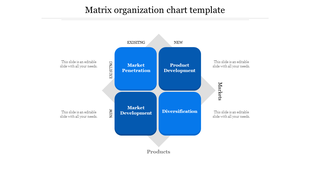
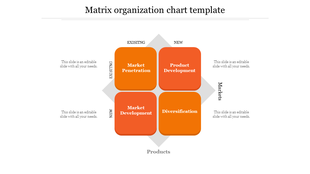
PowerPoint slide displaying a yellow matrix organization chart with categories for existing and new markets and products.
Free
Add to Wishlist Download Edit
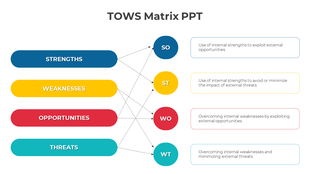
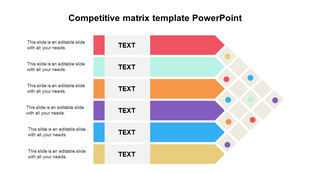
Horizontal TOWS matrix with blue, yellow, red, and teal bars, each linked to circular strategy nodes on the right.
Free
Add to Wishlist Download Edit
Download Unlimited Matrix Organization Chart Template
Free
Add to Wishlist Download Edit
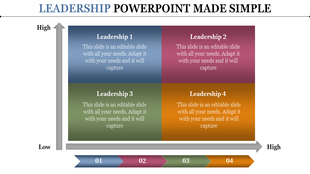
Leadership PPT slide with a 2x2 grid, showing four leadership levels with captions and a scale from low to high.
Free
Add to Wishlist Download Edit
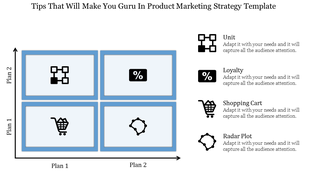
Infographic displaying a 2x2 blue-bordered matrix with icons unit structure, percentage, shopping cart, and radar chart.
Free
Add to Wishlist Download Edit
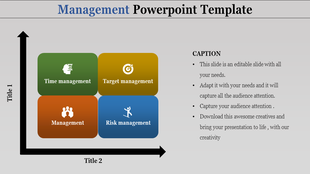
Management themed slide with green, yellow, blue, and orange blocks labeled time, target, risk, and general management.
Free
Add to Wishlist Download Edit
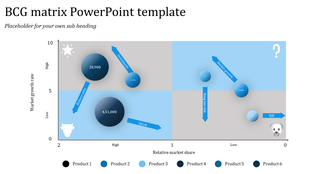
BCG matrix slide displaying company products in four market categories, with numerical values inside bubbles and arrows.
Free
Add to Wishlist Download Edit
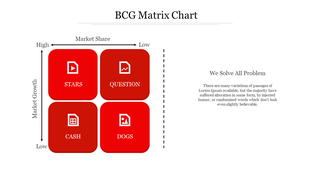
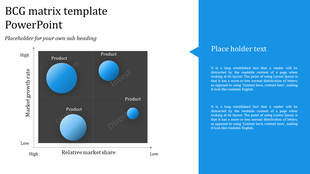
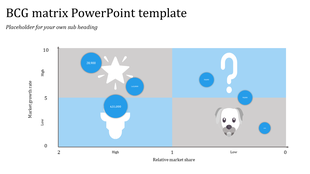
BCG Matrix chart with four quadrants labeled stars, question, cash, and dogs, arranged by market share and growth.
Free
Add to Wishlist Download Edit
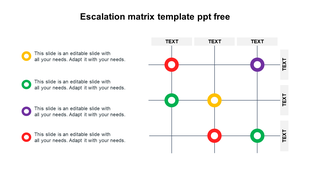
Simple escalation matrix template with a grid layout and color markers in yellow, green, purple, and red with text captions.
Free
Add to Wishlist Download Edit
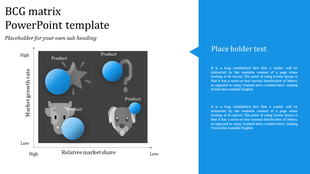
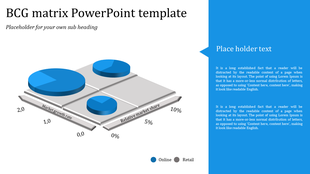
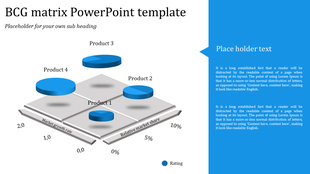
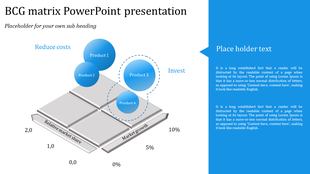
BCG matrix with four gray quadrants containing blue 3D circles representing products, and a text box on the right.
Free
Add to Wishlist Download Edit
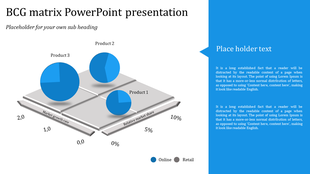
Four blue circular product nodes on a 3D gray matrix, and a side text area for additional content.
Free
Add to Wishlist Download Edit
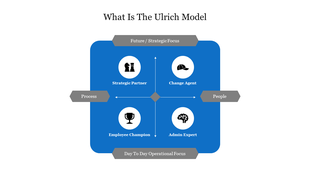
Visual representation of the ulrich model, highlighting roles in strategic focus and operational focus quadrants.
Free
Add to Wishlist Download Edit
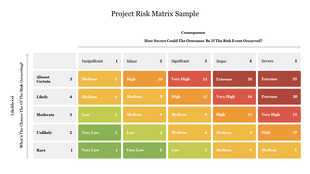
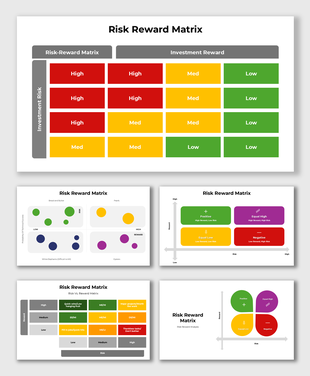
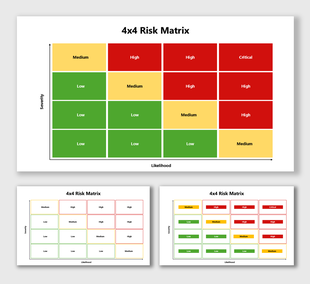
4x4 Risk Matrix with color-coded risk levels: green (low), yellow (medium), red (high), critical, mapping severity.
Free
Add to Wishlist Download Edit
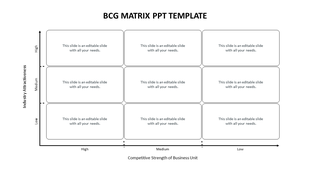
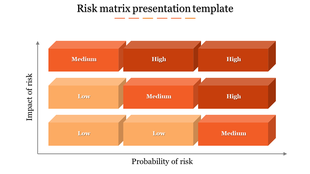
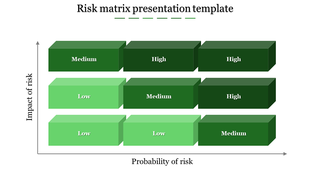
Risk matrix template illustrating low to high probability and impact, categorized into low, medium, and high risk levels.
Free
Add to Wishlist Download Edit
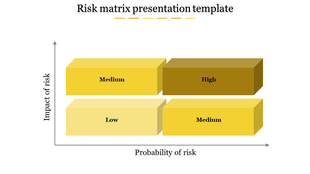
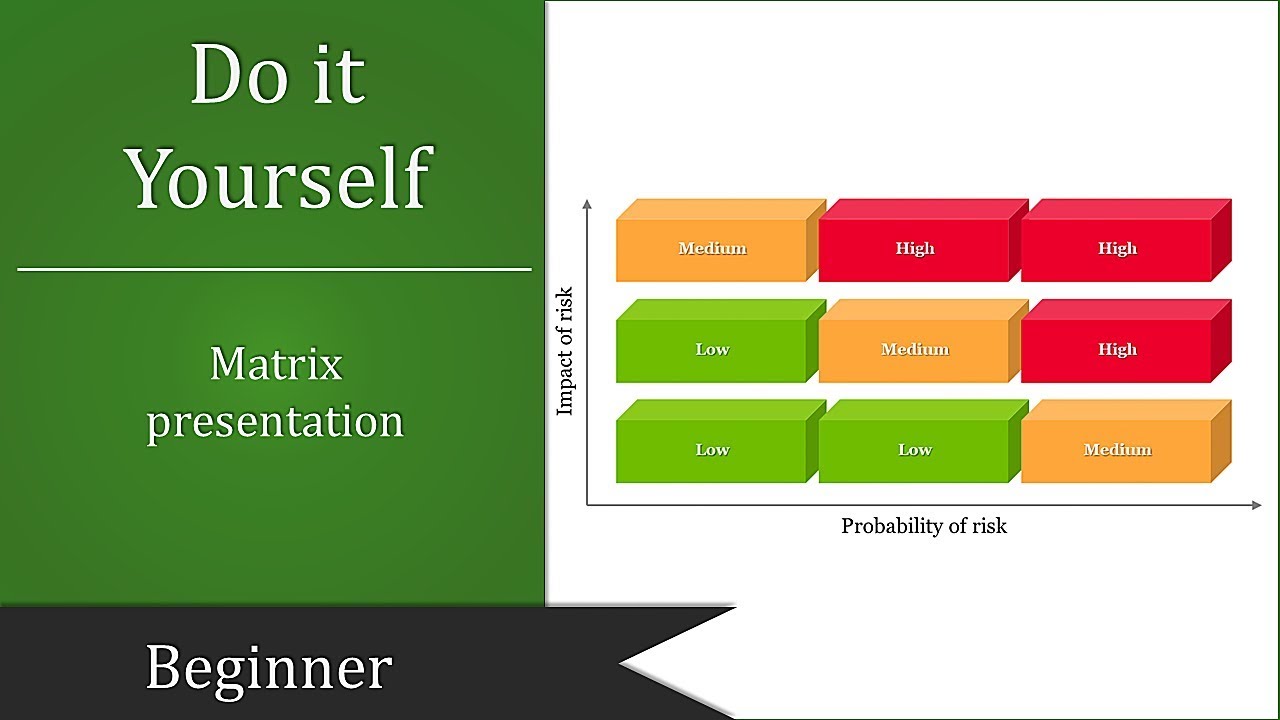
Risk matrix chart slide showing impact vs. probability with categories for medium, high, and low risks.
Free
Add to Wishlist Download Edit
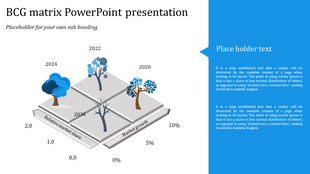
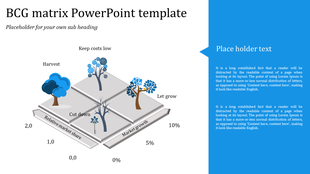
BCG matrix slide with a 3D grid, showcasing tree illustrations to represent business decisions based on market share.
Got a Unique Idea? Craft with AI
Credits left : 0

Make Your Presentations Stand Out with Eye-Catching Free Matrix PowerPoint Templates and Google Slides Themes!


Looking for a way to present complex information in a clear and engaging way? Try our collection of premade matrix presentation templates!

What is a Matrix Presentation?

Imagine a table with rows and columns. Each row and column represents a different category or idea. By filling the boxes (cells) with information, you can easily show the relationships between those categories and ideas. This is called a matrix presentation.

How to Use a Matrix in PowerPoint (PPT)?

While you can create a basic matrix in PPT, using a pre-made template saves you time and effort. Our templates come with ready-made layouts, so you can simply add your content.

How Our Pre-made Matrix Slides Help You:

Our slides make things easier. You save time because you don't have to create the matrix from the beginning. Simply pick a template and add your information. It makes you look professional because our templates are nice to look at and easy to understand. With less time spent on design, you can concentrate more on what you want to say.

Why Choose Our Matrix Slides for PowerPoint Presentations?

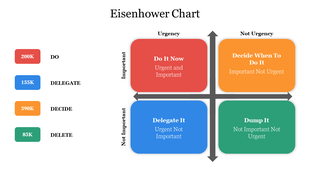
  • Variety of Designs: Find slides for different types of matrices, like BCG, ambition, Eisenhower, Quad chart, Escalation, Kraljic, Ge McKinsey, Moscow Method, Mekko chart matrix, urgent important matrix, Ulrich model, and more.
  • Multiple Colors and Styles: Choose a design that matches your presentation theme.
  • Easy to Edit: Change the text, colors, and graphics to fit your needs.
  • Free and Paid Options: We offer both free and paid templates to suit your budget.

Who Can Use Our Slides?

Our slides are helpful for a variety of people who want to present information in a clear and organized manner. This includes educators and students who need to explain complex concepts, professionals in the business world who use matrices for data presentation and strategic analysis, as well as non-profit organizations and other groups who want to communicate information about their programs and initiatives effectively.

Benefits of Our Slides:

  • Royalty-Free: Use the slides for any personal or commercial project.
  • 100% Editable: Customize everything to match your specific needs.
  • Multiple Formats: Available in both PowerPoint (PPTX) and Google Slides formats.
  • Multiple Orientations: Choose between portrait and landscape layouts.
  • Free Options Available: Try some of our templates for free before you buy.

Explore our gallery of matrix presentation templates today! Find the perfect one to fit your needs and create a presentation that will leave a lasting impression on your audience.

Explore Similar Collections

Become an expert with SlideEgg

Watch quick, practical walkthroughs and level up your presentation design skills in minutes.

Frequently Asked Questions

1. Why do teams get stuck when evaluating options without a matrix?

Because without a structured framework, evaluation becomes opinion-based. Each person has a preference but no objective way to compare. Debate goes in circles. A matrix forces you to name criteria upfront and score each option against them. Suddenly there's a shared language and people can see why one option scores higher than another.

2. What's the difference between subjective debate and objective matrix evaluation?

Subjective: "I think this option is better because..." Objective: "This option scores 8/10 on cost, 7/10 on speed, 9/10 on quality — totaling 24 points. That option scores 6/10, 9/10, 5/10 — totaling 20 points." The matrix makes it visible. Numbers replace opinions. Teams see the reasoning, not just the conclusion.

3. How do I set up criteria that the team actually agrees on?

Start with what matters for YOUR decision. Cost? Timeline? Quality? Team fit? Risk? List 4-6 criteria maximum. Ask the team: "Are these the things that matter most?" If everyone nods, you have buy-in. If someone disagrees, that's when the real discussion happens — BEFORE scoring. Once criteria are agreed, scoring becomes much easier because everyone knows what you're measuring.

4. How do I prevent the matrix from becoming another opinion tool?

Define your scoring scale first: What does a "7" mean vs a "9"? Be specific. "Cost: 10 = under $10K, 7 = $10-20K, 4 = over $20K." Without definitions, scoring stays subjective. With them, scoring becomes almost mechanical. Different people will score differently, but the spread is visible. That's actually useful — it shows where disagreement lives.

5. What if the team strongly disagrees on which option should win?

That's valuable information. The matrix didn't fail — it revealed that you're optimizing for different things. Maybe some people weight cost heavily, others weight speed. The matrix makes that visible. Now you can have the REAL conversation: "Do we want the cheapest option or the fastest?" Not hidden behind opinions, but explicit and discussable.

6. How do I use a matrix to justify a decision to stakeholders?

Show them the framework and scoring. "We evaluated three options against these criteria: cost, timeline, quality, and team fit. Here's how each scored. This option won because it balanced all factors best." Stakeholders see the logic, not just the choice. They might disagree with the criteria or weights, but they understand your reasoning. That's defensible.
7. What if I'm the only one who thinks an option is good but the matrix says it's not?

The matrix is showing you something. Either your criteria are wrong, your scoring is off, or you're optimizing for something the criteria don't capture. Don't ignore the matrix — question it. "I still like this option. What am I weighing that the matrix isn't capturing?" Maybe you need a new criterion. Maybe you need to rescore. The matrix isn't the final word — it's a conversation tool.