Amazing Planned Vs Achieved PPT And Google Slides Templates

Pack of 11 slides
P.ID : 72458
Advertisement
521 views
98 Downloads
Get Custom Slides by Experts
Instantly Access Templates in PowerPoint

Creative Planned Vs Achieved PPT Templates


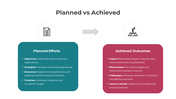
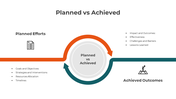
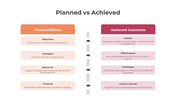
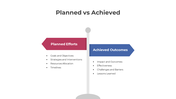
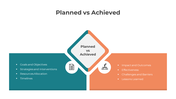
Explore the Planned Vs Achieved is a comparison method used to evaluate the difference between set goals and actual outcomes over a specific period. It is utilized by businesses to monitor project performance, sales targets, and financial goals; by project managers to evaluate timelines and deliverables; by educators to assess student progress; by government agencies to track policy implementation; and by nonprofits to measure program impacts. 


Our multicolor theme template visually presents this comparison, featuring sections for setting targets, tracking progress, highlighting achievements, identifying gaps, and outlining corrective actions. The vibrant colors enhance clarity and engagement, making it easier to understand performance metrics and areas needing improvement.


Features of this templates


  • 100% customizable slides and easy to download.
  • The slide contains 16:9 and 4:3 formats.
  • Easy to change the colors of the slide quickly.
  • Highly compatible with PowerPoint and Google Slides.

You May Also Like These PowerPoint Templates

Add to Wishlist
Download
AI Customize
Comparison chart slide showing the differences between a leader and a supervisor, with icons and bullet points for each role.
Add to Wishlist
Download
AI Customize
A superlative slide showing three individuals, with labels from short to shortest with placeholder text.
Add to Wishlist
Download
AI Customize
Two column competitor chart showing varying percentage comparisons with multicolored bars for each row.
Add to Wishlist
Download
AI Customize
A series of four colorful gears in yellow, red, green, and blue, each labeled with a percentage and numbered captions.
Add to Wishlist
Download
AI Customize
Two side by side images of engineers with performance, punctuality, and overtime bars in green and blue below each.
Add to Wishlist
Download
AI Customize
Two side by side rectangular boxes in red and purple, each featuring icons at the top and bullet points inside.
Add to Wishlist
Download
AI Customize
Comparison chart slide displaying various metrics with color coded bars and icons indicating performance across categories.
Add to Wishlist
Download
AI Customize
A product comparison table slide showing three products evaluated across six options using green, yellow, and red dots.
Add to Wishlist
Download
AI Customize
Two arrows at the top in orange and green representing forces, with three rows of content boxes below, each numbered.
Add to Wishlist
Download
AI Customize
Slide comparing the roles of Data Scientists and Data Engineers, detailing their responsibilities and programming languages.
Add to Wishlist
Download
AI Customize
Innovate Myth Vs Facts PowerPoint And Google Slides
Add to Wishlist
Download
AI Customize
A slide diagram linking causes on the left to effects on the right, is divided into four colored captions.
Add to Wishlist
Download
AI Customize
Two-column layout illustrating Herzberg's Theory with dissatisfaction factors in red and satisfaction factors in green.
Add to Wishlist
Download
AI Customize
Two side-by-side columns with green and orange borders, each with numbered text and connected by a phone icon.
Free
Add to Wishlist
Download
AI Customize
Slide showing Yin and Yang symbol flanked by lists of characteristics for each side Yang on the left and Yin on the right.
Add to Wishlist
Download
AI Customize
Side by side comparison of leadership and management traits, highlighting key attributes and responsibilities.
Add to Wishlist
Download
AI Customize
Slide featuring a visual representation of a seesaw with icons indicating upward and downward movement with captions.
Add to Wishlist
Download
AI Customize
Comparison template showing a male-to-female ratio with percentages and text sections under each gender.
Free
Add to Wishlist
Download
AI Customize
Comparison of program and project benefits displayed in parallel columns with color coded highlights.
Add to Wishlist
Download
AI Customize
A split design with red and teal semi-circles, with four matching icons arranged in a symmetrical layout.
Add to Wishlist
Download
AI Customize
Demographic comparison slide with red male and blue female icon, with percentage values and text areas below each.
Add to Wishlist
Download
AI Customize
Slide deck showing a comparison between product and service characteristics, with colorful diagrams and flowcharts.
Add to Wishlist
Download
AI Customize
Comparison presentation slide with two options, featuring check and cross icons to show differences between items.
Add to Wishlist
Download
AI Customize
A pack of creative comparison slides showcasing now and future with a woman contemplating at a signpost and various layouts.
Add to Wishlist
Download
AI Customize
Slide deck with various comparison formats showing differences, using circular and rectangular layouts  in orange and teal.