Gap Analysis Diagram PPT Presentation and Google Slides

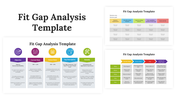
Amazing Gap Analysis PPT Template
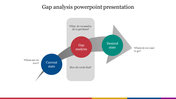
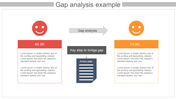
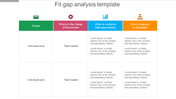
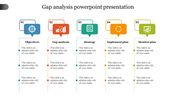
The gap analysis assesses a business unit to determine whether the requirements are met according to its vision and mission. The team members or head can note the work process and make it easier for the business flow. The gap analysis makes the business growth stable and significantly affects the proportion of the units. Use this five-node template by editing and bringing in more topic details into that arrow-designed presentation. The user-friendly features can enhance the presentation view and bring out the difference. Grab now!
Features of the template
- 100% customizable slides and easy to download.
- Slides are available in different nodes & colors.
- The slide contains 16:9 and 4:3 formats.
- Easy to change the colors of the slide quickly.
- Well-crafted template with instant download facility.
- Five nodes with text area.


You May Also Like These PowerPoint Templates
Add to Wishlist
Download
Edit


Add to Wishlist
Download
Edit

Add to Wishlist
Download
Edit

Add to Wishlist
Download
Edit

Add to Wishlist
Download
Edit

Add to Wishlist
Download
Edit

Add to Wishlist
Download
Edit

Add to Wishlist
Download
Edit

Add to Wishlist
Download
Edit

Add to Wishlist
Download
Edit

Add to Wishlist
Download
Edit


Add to Wishlist
Download
Edit

Add to Wishlist
Download
Edit

Add to Wishlist
Download
Edit

Add to Wishlist
Download
Edit

Add to Wishlist
Download
Edit

Add to Wishlist
Download
Edit

Add to Wishlist
Download
Edit
