Effective gap analysis diagram With Multicolor Circular Icons

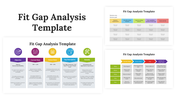
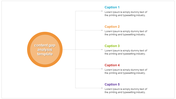
Effective Gap Analysis Diagram Template
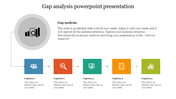
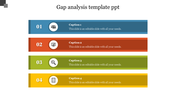
A gap analysis PowerPoint template shows the relations among variables measured over time and within a particular data set. This template will help you present important information about Gap Analysis. The icons on the slide will help the audience to get an idea about your core content. You can include text, color in your PPT to make it look nice. Users can use this template in financial meetings or business meetings.
About this template:
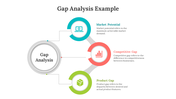
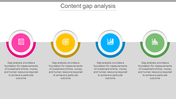
It is a multicolored template with four multicolored circles. The four icons help you to present important information to the audience. This template is easily understandable by people who are new to your project. However, users can add more rows and columns, and text boxes to improve the presentation's look and feel. This slide has a beautiful design with creative text boxes and multiple circle nodes. In addition, We also have a wide range of Gap analysis presentation slides.
Benefits you get from this template:
- This template is 100% editable and free to download.
- For example, you can change the icon colors in this PowerPoint slide.
- This template reports in less time so that viewers understand its purpose.
- In addition, the template helps to show the regular timeline.
Features of this template:
- 100 % customizable slides and easy to download.
- Slides available in different nodes & colors.
- This slide supports 16:9 and 4:3 format.
- Easy to change the slide colors quickly.
- Easily readable and acceptable template.
- Vast Numbers of coffee slides to impress your audience.


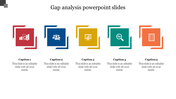
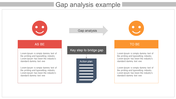
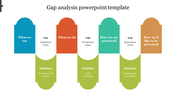
You May Also Like These PowerPoint Templates
Add to Wishlist
Download
Edit

Add to Wishlist
Download
Edit


Add to Wishlist
Download
Edit

Add to Wishlist
Download
Edit

Add to Wishlist
Download
Edit

Add to Wishlist
Download
Edit

Add to Wishlist
Download
Edit

Add to Wishlist
Download
Edit

Add to Wishlist
Download
Edit

Add to Wishlist
Download
Edit


Add to Wishlist
Download
Edit

Add to Wishlist
Download
Edit

Add to Wishlist
Download
Edit
