Editable Effective Ways To Analysis PowerPoint Template

Analysis template with four orange ovals featuring icons and text, positioned with shadows for a 3D effect.
P.ID : 27337
    118 views
    1 Downloads
    Get Custom Slides by Experts
    Instantly Access Templates in PowerPoint

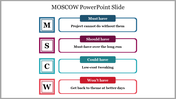
    Effective Ways to Analyze PowerPoint Presentations and Google Slides


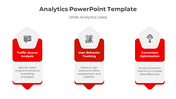
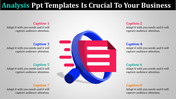
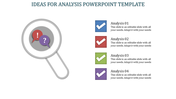
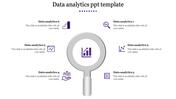
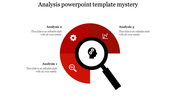
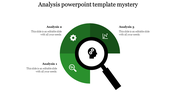
    Analyzing a PowerPoint presentation effectively can transform your business communications. When incorporating data analysis, it’s crucial to use an oval design with four nodes, leveraging professional shades to maintain a polished look. Start by structuring your slides to highlight key data points. Here’s a step-by-step approach:

    • Organize Your Data: Categorize information into four nodes for clarity and visual appeal.
    • Use Professional Colors: Stick to a cohesive color scheme to ensure your presentation looks sleek and professional.
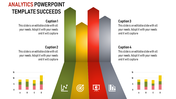
    • Simplify Complex Data: Break down intricate data sets into easily digestible visuals, making sure each node tells a part of the story.
    • Engage with Visuals: Incorporate charts, graphs, and infographics within the oval design to illustrate your points effectively.
    By following these steps, you’ll create a presentation that not only looks good but also communicates your data analysis clearly and compellingly. This approach is perfect for making your business presentations both informative and engaging.

    Features of the template

    • 100% customizable slides and easy to download.
    • Slides are available in different nodes & colors.
    • The slide contains 16:9 and 4:3 formats.
    • Easy to change the colors of the slide quickly.
    • Well-crafted template with an instant download facility.
    Advertisement

    You May Also Like These PowerPoint Templates

    Add to Wishlist
    Download
    AI Customize
    Market analysis PowerPoint template featuring six percentage milestones from 30 to 90 with corresponding captions.
    Add to Wishlist
    Download
    AI Customize
    Market analysis infographic with a yellow open box at the bottom, connected to four colored captions labeled 1 to 4.
    Add to Wishlist
    Download
    AI Customize
    A PPT slide showcasing a business analytics theme with icons for analysis, data, and insights, surrounded by six captions.
    Add to Wishlist
    Download
    AI Customize
    Business analysis slide showcasing steps with icons around a central illustration with a text description.
    Add to Wishlist
    Download
    AI Customize
    Competitor analysis presentation slide featuring progress bars with business building background with placeholder text.
    Add to Wishlist
    Download
    AI Customize
    The Best Situation Analysis Template Slide Presentation
    Add to Wishlist
    Download
    AI Customize
    Dark themed slide featuring analytics elements, including a magnifying glass, mobile device, and percentages in bold.
    Add to Wishlist
    Download
    AI Customize
    Slides featuring Venn diagrams and flowcharts in blue, purple, and orange, explaining diversity, equity, and inclusion.
    Add to Wishlist
    Download
    AI Customize
    Financial analysis slide with icons of coins, hand with cash, transaction, and refund on clipped sheets.
    Add to Wishlist
    Download
    AI Customize
    Easily Usable Performance PPT And Google Slides Template
    Add to Wishlist
    Download
    AI Customize
    Six pie analysis charts in blue, red, orange, green, teal, and purple, displaying percentages from 15% to 90%.
    Add to Wishlist
    Download
    AI Customize
    A colorful risk analysis matrix slide chart, displaying low, medium, high, and extreme risk levels in a grid format.
    Add to Wishlist
    Download
    AI Customize
    Linear timeline showing red triangular nodes connected by dots, each node containing an icon and caption.
    Add to Wishlist
    Download
    AI Customize
    Attractive Business Analytics PowerPoint Template Design
    Add to Wishlist
    Download
    AI Customize
    A person working on a laptop with analysis data, alongside bar charts with percentage and text box, on a gray background.
    Add to Wishlist
    Download
    AI Customize
    Circular waffle chart with segmented colored sections in blue, orange, teal, and red, representing percentage values.
    Add to Wishlist
    Download
    AI Customize
    Analytics slide with line graph, pie chart, and statistics showing 13M views, 13M active subscribers, and 991K subscribers.