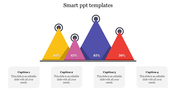
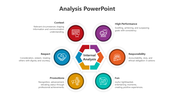
Effective Ways To Analysis PowerPoint Template Blue Color Model

Best effective ways to analysis slide show four types each with descriptive icons.
P.ID : 27334
    11 slides
    Customize Feasibility Study PPT And Google Slides Themes
    16 slides
    Slide deck with coloful infographics and diagrams explaining target market analysis, segments, and customer base analysis.
    13 slides
    Slide deck featuring multiple analysis templates with colorful layouts, charts, and icons for data representation.
    114 views
    4 Downloads
    Get Custom Slides by Experts
    Instantly Access Templates in PowerPoint

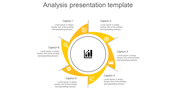
    Effective Ways To Analysis Presentation Template


    Data analysis is pivotal in decision-making since it can help managers assess and understand all the available information. Our Effective Ways to Analysis PowerPoint template will be useful in helping deliver information regarding data analysis in simple and compelling PowerPoint. 


    Slide Description:

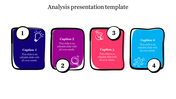
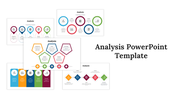
    Included on the slide are four elliptical shapes Job, SWOT, Semen, and Philosophical each of which has an icon and a placeholder text.

    Who can benefit?

    BA, HR, Management professionals, Managers, Data analysts, Coaches, Philosophers, Educators, and anyone working in the subject areas of Business, Management, and philosophy.


    Why is Analysis used?

    It aids you in discovering and understanding patterns in data, as well as communicating these patterns with others.

    Get our templates today and reverse this situation, transform your analyses into visuals that will make more sense and encourage action.


    Features of the template:


    •  Slides are available in 4:3 & 16:9
    • Get slides that are 100% customizable and easy to download
    • Highly compatible with PowerPoint and Google Slides
    Advertisement

    You May Also Like These PowerPoint Templates

    Add to Wishlist
    Download
    AI Customize
    Performance template with four linked circles labeled from finance to business processes, each with bullet points and icons.
    Add to Wishlist
    Download
    AI Customize
    Colorful circular analysis template featuring six sections with icons growth, target, people, settings, data, and analytics.
    Add to Wishlist
    Download
    AI Customize
    Blue infographic with location pins displaying percentages for market analysis, arranged in a triangular layout.
    Add to Wishlist
    Download
    AI Customize
    Business growth analysis slide featuring a cartoon character with a telescope showing a bar chart, and four captions.
    Add to Wishlist
    Download
    AI Customize
    Situation analysis PPT slide featuring icons for industry research and firm capabilities with captions in two colored boxes.
    Add to Wishlist
    Download
    AI Customize
    Bar graph in multiple colors showing evolution over years, with a human figure and three text boxes on the right.
    Add to Wishlist
    Download
    AI Customize
    Innovative Current Situation PowerPoint And Google Slides
    Add to Wishlist
    Download
    AI Customize
    Best Target Operation Model PowerPoint Presentation
    Add to Wishlist
    Download
    AI Customize
    Pack of slides with colorful icons and sections for various data analysis, including visuals and layouts.
    Free
    Add to Wishlist
    Download
    AI Customize
    Analysis PowerPoint slide featuring a bar graph and vehicle icons with placeholders for text and subheadings.
    Free
    Add to Wishlist
    Download
    AI Customize
    Analysis slide with six segmented circular progress charts in gray and orange, each linked by gray bars and labeled below.
    Free
    Add to Wishlist
    Download
    AI Customize
    Analysis PowerPoint slide showcasing a target with an arrow, a chart, and a message box with caption text.
    Add to Wishlist
    Download
    AI Customize
    Performance slide with four quadrants in red, green, teal, and blue, connected in a circular flow with relevant text.
    Free
    Add to Wishlist
    Download
    AI Customize
    Grayscale process flow diagram with three horizontal arrows, numbered 01 to 03, showing analysis steps.
    Free
    Add to Wishlist
    Download
    AI Customize
    Green concentric circles with the word why in the center, connected to six captions on a light gray background.
    Free
    Add to Wishlist
    Download
    AI Customize
    Creative word cloud in a circular layout highlighting key terms such as statistical, business, and analysis.
    Free
    Add to Wishlist
    Download
    AI Customize
    Free Slide Layouts PowerPoint Template For Business
    Add to Wishlist
    Download
    AI Customize
    Slide with a marketing competitor analysis template showing a 2x2 matrix with colored bubbles labeled A to D.
    Free
    Add to Wishlist
    Download
    AI Customize
    Dark background slide featuring a yellow, green, red, and blue pinwheel shape surrounded by captions with percentages.