Effective Ways To Analysis PowerPoint And Google Slides

Red oval infographic with sections for Job, Semen, and Data, accompanied by icons and descriptions.
P.ID : 27393
    93 views
    1 Downloads
    Get Custom Slides by Experts
    Instantly Access Templates in PowerPoint

    Effective Ways To Analysis PPT Presentation


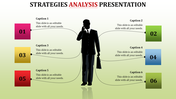
    Let's face it, data presentations can be a snooze fest. But what if you could turn yours into an engaging adventure? This Effective Ways to Analysis PowerPoint template is your secret weapon!

    Image: Three connected ovals guide you through analysis, step-by-step. Your audience will be on the same page in no time.

    Design:  Red ovals create a dynamic framework that makes your analysis pop.

    Easy To Edit:  Fill each oval with your findings – complete customization is yours!

    This template transforms your data into clear, actionable insights that will have your audience riveted.

    Features of the template


    • 100% customizable slides and easy to download.
    • The slides contain 16:9 and 4:3 formats.
    • Easy to change the colors quickly.
    • It is a well-crafted template with an instant download facility.
    • It is a 100% pre-designed slide.
    • The slide holds vibrant colors.
    Advertisement

    You May Also Like These PowerPoint Templates

    Free
    Add to Wishlist
    Download
    AI Customize
    Timeline template showing a journey from 2016 to 2020 with icons for research, finance, analytics, intelligence, and success.
    Add to Wishlist
    Download
    AI Customize
    Social media icons with placeholder text and four colorful data icons on the right.
    Add to Wishlist
    Download
    AI Customize
    Results template showing research and analysis steps, with visual data on men and women in a company showings their earnings.
    Add to Wishlist
    Download
    AI Customize
    Business analysis bar chart slide with six colored bars representing different activities and percentages with text area.
    Add to Wishlist
    Download
    AI Customize
    A pack of slides with a colorful SCQA framework illustrating icons with visual charts and layouts.
    Add to Wishlist
    Download
    AI Customize
    The thematic analysis slide diagram shows the process from qualitative data to codes and themes in three colors.
    Add to Wishlist
    Download
    AI Customize
    Analysis PowerPoint Presentation And Google Slides Themes
    Free
    Add to Wishlist
    Download
    AI Customize
    Download Financial Analysis PowerPoint Presentation
    Add to Wishlist
    Download
    AI Customize
    Dupont analysis overview slides illustrating the calculation of profit margin with different layout designs with icons.
    Add to Wishlist
    Download
    AI Customize
    Current state analysis slide comparing cost reduction and value creation strategies with two colored boxes and text caption.
    Add to Wishlist
    Download
    AI Customize
    An infographic showing three stages of a research paradigm in red, orange and green in hexagon shape each with icons.
    Add to Wishlist
    Download
    AI Customize
    A reflective learning process slide shows four stages each in colorful boxes with text descriptions.
    Add to Wishlist
    Download
    AI Customize
    Grid of various plot diagram slides showcasing narrative arcs, with labels for different stages of a plot's progression.
    Add to Wishlist
    Download
    AI Customize
    RCA diagram with a gray section and four colored text box in orange, purple, blue, and yellow on the right.