Data Center PowerPoint Template and Google Slides


Data Center PowerPoint Template and Google Slides
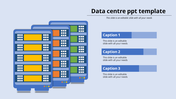
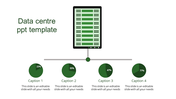
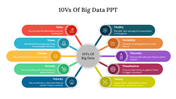
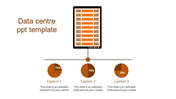
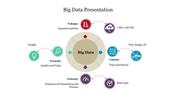
Empower your data-centric presentations with our innovative template, featuring a dynamic combination of elements designed to captivate and inform. At its core lies a circular pie chart adorned with percentages and informative captions, offering a visual representation of data distribution and analysis.
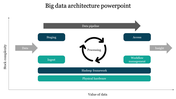
Complementing this visual centerpiece is an abacus-inspired structure, meticulously filled with dates to symbolize the precision and organization inherent in data management. This hierarchical arrangement seamlessly connects the pie chart and abacus, forming a cohesive narrative around data analytics.
Tailored for professionals seeking to communicate complex data concepts with clarity and impact, our template provides a comprehensive framework for presenting data center strategies, analytics insights, and performance metrics. Download the Data Center PowerPoint Template and Google Slides today, and elevate your data-driven presentations to new heights of effectiveness and engagement.
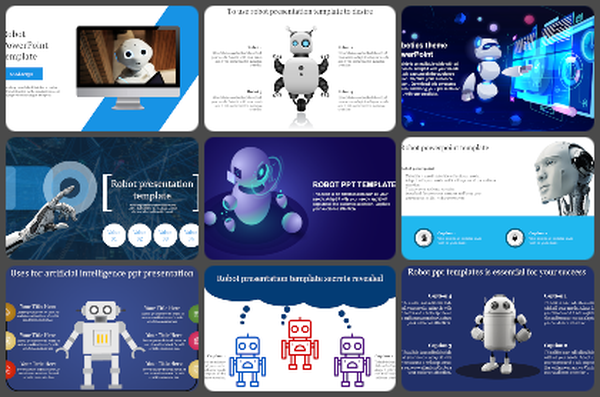
Features of the template
- 100% customizable slides and easy to download.
- Slides are available in different nodes & colors.
- The slide contains 16:9 and 4:3 formats.
- It is easy to change the colors of the slide quickly.
- Well-crafted template with an instant download facility.

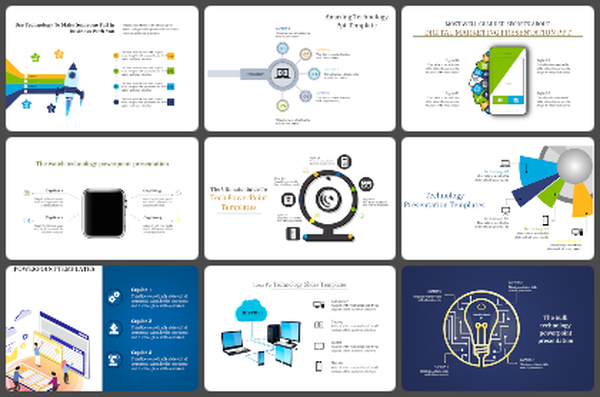
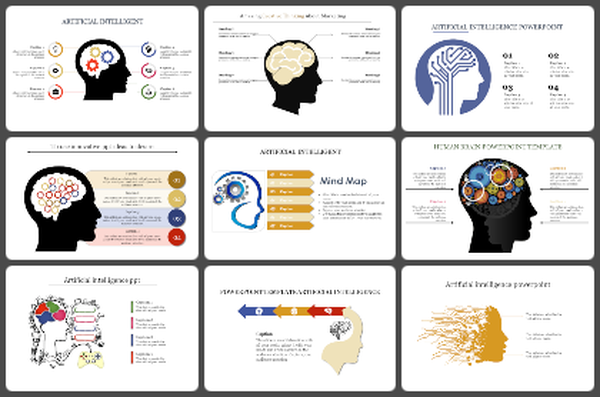


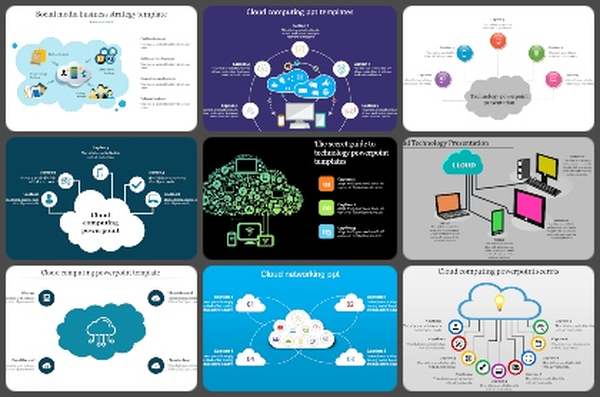
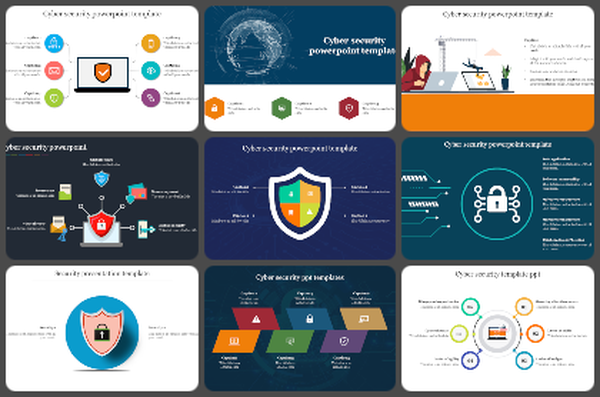

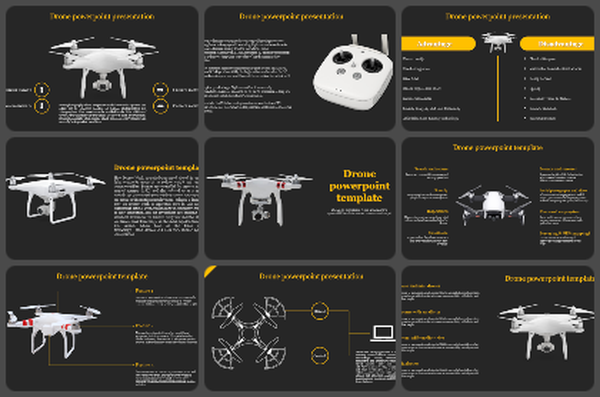
You May Also Like These PowerPoint Templates
Add to Wishlist
Download
Edit

Add to Wishlist
Download
Edit

Add to Wishlist
Download
Edit

Add to Wishlist
Download
Edit

Add to Wishlist
Download
Edit

Add to Wishlist
Download
Edit

Add to Wishlist
Download
Edit

Add to Wishlist
Download
Edit

Add to Wishlist
Download
Edit


Add to Wishlist
Download
Edit

Add to Wishlist
Download
Edit

Add to Wishlist
Download
Edit

Add to Wishlist
Download
Edit

Add to Wishlist
Download
Edit

Add to Wishlist
Download
Edit

Add to Wishlist
Download
Edit

Add to Wishlist
Download
Edit

Add to Wishlist
Download
Edit

Add to Wishlist
Download
Edit
