Effective Analysis PPT Template and Google Slides Themes

Analysis PPT slide with four colored stages, each representing different percentage values with placeholder text.
P.ID : 13328
    278 views
    14 Downloads
    Get Custom Slides by Experts
    Instantly Access Templates in PowerPoint

    Analysis PPT Template and Google Slides Themes


    Are you struggling to create compelling presentations that effectively communicate detailed analysis and insights? The Analysis PowerPoint Template and Google Slides themes provide a solution tailored to your needs. 


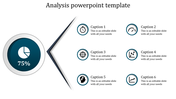
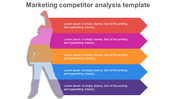
    With customizable features including text, fonts, colors, and charts, users can personalize their presentations to match specific analytical requirements. The template's light-colored backdrop offers a professional environment, ensuring the audience's focus remains on the content, whether it's market trends, financial performance, or statistical analysis.


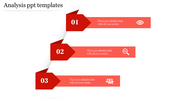
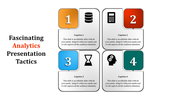
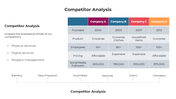
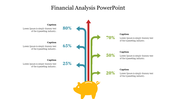
    Editable charts and graphs enable presenters to convey complex data clearly and succinctly, enhancing audience understanding and engagement. Users have access to various visualization options such as bar graphs and pie charts, allowing them to choose the most effective way to illustrate their analysis.


    Ideal for business professionals, researchers, educators, and analysts, this template simplifies the process of presenting analytical insights effectively. Its user-friendly interface and customization options make it adaptable for analytical presentations across diverse industries and fields. Download now!


    Features of the template

    • 100% customizable slides and easy to download.
    • Slides are available in different nodes & colors.
    • The slide contains 16:9 and 4:3 formats.
    • It is easy to change the colors of the slide quickly. 
    • Well-crafted template with an instant download facility.

    Advertisement

    You May Also Like These PowerPoint Templates

    Free
    Add to Wishlist
    Download
    AI Customize
    Engineer-focused slide with a figure in a yellow hard hat, flanked by green arrows denoting processes.
    Add to Wishlist
    Download
    AI Customize
    PESTEL analysis slide with hexagonal icons representing political to legal factors, each with captions.
    Add to Wishlist
    Download
    AI Customize
    PowerPoint slide with a colorful PESTEL analysis format, divided into six sections with icons and text for each factor.
    Add to Wishlist
    Download
    AI Customize
    Colorful PESTLE analysis template with each section labeled for different business factors with placeholder text.
    Free
    Add to Wishlist
    Download
    AI Customize
    Timeline template showing a journey from 2016 to 2020 with icons for research, finance, analytics, intelligence, and success.
    Add to Wishlist
    Download
    AI Customize
    Social media icons with placeholder text and four colorful data icons on the right.
    Add to Wishlist
    Download
    AI Customize
    Results template showing research and analysis steps, with visual data on men and women in a company showings their earnings.
    Add to Wishlist
    Download
    AI Customize
    Business analysis bar chart slide with six colored bars representing different activities and percentages with text area.
    Add to Wishlist
    Download
    AI Customize
    Pack of slides with colored circles and nodes in various layouts depicting stages of quality assurance in vibrant colors.
    Add to Wishlist
    Download
    AI Customize
    A pack of slides with a colorful SCQA framework illustrating icons with visual charts and layouts.
    Add to Wishlist
    Download
    AI Customize
    The thematic analysis slide diagram shows the process from qualitative data to codes and themes in three colors.
    Add to Wishlist
    Download
    AI Customize
    Analysis PowerPoint Presentation And Google Slides Themes
    Free
    Add to Wishlist
    Download
    AI Customize
    Download Financial Analysis PowerPoint Presentation
    Add to Wishlist
    Download
    AI Customize
    Dupont analysis overview slides illustrating the calculation of profit margin with different layout designs with icons.
    Add to Wishlist
    Download
    AI Customize
    Current state analysis slide comparing cost reduction and value creation strategies with two colored boxes and text caption.
    Add to Wishlist
    Download
    AI Customize
    An infographic showing three stages of a research paradigm in red, orange and green in hexagon shape each with icons.
    Add to Wishlist
    Download
    AI Customize
    A reflective learning process slide shows four stages each in colorful boxes with text descriptions.