Best Sales Forecasting And Budgeting Planning PowerPoint

Best Sales Forecasting And Budgeting Planning PowerPoint
P.ID : 70723
    205 views
    34 Downloads
    Get Custom Slides by Experts
    Instantly Access Templates in PowerPoint

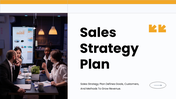
    Forecasting And Budgeting Planning Presentation Slide


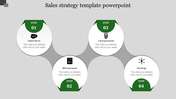
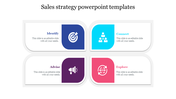
    Forecasting and Budgeting Planning are integral components in steering an organization's financial trajectory. Through adept forecasting, businesses can predict revenue streams and market trends, laying the foundation for informed decisions. Concurrently, budgeting ensures disciplined financial management, outlining how resources should be allocated to achieve set objectives. This presentation template elucidates the complexities of Forecasting and Budgeting Planning with precision. Its well-structured design facilitates a clear breakdown of both processes, offering insightful data representation and analysis. By utilizing this tool, presenters can seamlessly communicate intricate financial strategies, ensuring their audience not only grasps the concepts but also recognizes the paramount importance of proactive financial planning.


    Features of the templates:


    • 100% customizable slides and easy to download.
    • Slides are available in different nodes & colors.
    • The slide contained 16:9 and 4:3 formats.
    • Easy to change the slide colors quickly.
    • It is a well-crafted template with an instant download facility.
    • Highly compatible with PowerPoint and Google Slides.
    Advertisement

    You May Also Like These PowerPoint Templates

    Add to Wishlist
    Download
    AI Customize
    Purple sales pipeline illustration slide showing marketing and sales process stages, from raw leads to conversion percentage.
    Add to Wishlist
    Download
    AI Customize
    Sales process PowerPoint slide showing a table with four stages from develop to operate with corresponding tasks.
    Add to Wishlist
    Download
    AI Customize
    A red circle in the center with four surrounding circular icons, in blue, yellow, orange, and purple, each with captions.
    Add to Wishlist
    Download
    AI Customize
    Circular diagram with five colorful segments in red, green, purple, yellow, and blue, surrounding a central briefcase icon.
    Add to Wishlist
    Download
    AI Customize
    Colorful funnel diagram with people icons on top, divided into six sections, and corresponding text areas on both sides.
    Free
    Add to Wishlist
    Download
    AI Customize
    Central document icon surrounded by six green icons connected to captions, with a green banner at the bottom.
    Add to Wishlist
    Download
    AI Customize
    Colorful infographic with seven steps, each represented by a triangle and bar, indicating a sales strategy plan.
    Add to Wishlist
    Download
    AI Customize
    Slide with four downward-pointing arrows in purple, red, orange, and teal, each with text and a title on the right.
    Add to Wishlist
    Download
    AI Customize
    Sales and marketing slide featuring two columns of captions and headings with a central placeholder icon.
    Add to Wishlist
    Download
    AI Customize
    A slide showing a colorful sales funnel diagram with stages from awareness to advocacy with placeholder text.
    Add to Wishlist
    Download
    AI Customize
    Sales slide with a blurred image of online shopping on a laptop screen, featuring project goals.
    Free
    Add to Wishlist
    Download
    AI Customize
    Circular diagram with a central black circle, connected to six colored rectangles by lines, each with text.
    Add to Wishlist
    Download
    AI Customize
    For sale signpost graphic with two price tags and caption areas in green and yellow, displaying percentages.
    Add to Wishlist
    Download
    AI Customize
    Vendor Relationship Management PPT And Google Slides
    Add to Wishlist
    Download
    AI Customize
    Infographic outlining cross selling and upselling plans, with key points on enhancing customer journeys and reviews.
    Add to Wishlist
    Download
    AI Customize
    A bar chart with four categories displaying stacked colored bars, representing three series in orange, blue, and red.