Free - Affordable Research And Development Data Driven PPT Slide
Free

 Canva
Canva


Save Your Money And Expand Your Research
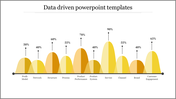
You can use this Research And Development Data-Driven PPT Slide template with four nodes to enter your facts and points related to your discussion. Use this template to showcase your research and development data about your topic elegantly.
The diagram presented here and the graphics around them look professional and magnificent with their colors. Inside them, the bar diagram carries all your desired facts about the analysis and fills your audience with immense information. The four Nodes are spacious through which you can enter many points.
Another appreciating feature about this template is that this is an accessible template that saves your money by giving you professional and creative slides. So, don't waste your time and start downloading this Research And Development Data-Driven PPT Slide from us.
Features Of This Template:
- 100% customizable slides and easy to download
- Slides are available in different nodes & colors.
- The slides contained 16:9 and 4:3 format.
- Easy to change the slide colors quickly.
- Well-crafted Template with instant download facility.
- Crisp and elegant font style.
- The best Template with attractive nodes.


You May Also Like These PowerPoint Templates
Add to Wishlist
Download
Edit

Add to Wishlist
Download
Edit

Add to Wishlist
Download
Edit

Add to Wishlist
Download
Edit

Add to Wishlist
Download
Edit

Add to Wishlist
Download
Edit

Add to Wishlist
Download
Edit

Add to Wishlist
Download
Edit


Add to Wishlist
Download
Edit


Add to Wishlist
Download
Edit


Add to Wishlist
Download
Edit

Add to Wishlist
Download
Edit

Add to Wishlist
Download
Edit

Add to Wishlist
Download
Edit
