Bar Chart Histogram Data Driven PowerPoint Template

 Canva
Canva


Share Informative Facts Using This Template:
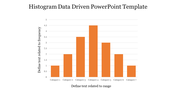
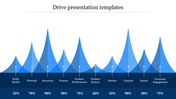
Get this seven noded histogram data driven PowerPoint template which saves you money drastically by presenting you with a high tech template. Explain about histogram data related topics and points using this template using the bar diagram given for you in the center. The seven nodes contain captions on the x and y axis that can be used to expand your topic vividly.
The colorful bar diagram presented to them gets highlighted with the white background. The diagram is filled with numbers to give minute explanation about your topic. You can find that this entire histogram data driven analytics PowerPoint template makes your work stress free and elegant with its features and attributes. This template carries your points flawlessly without any hindrance so use it now.
Features Of This Template:
- 100% customizable slides and easy to download
- Slides are available in different nodes & colors.
- The slides contained 16:9 and 4:3 format.
- Easy to change the slide colors quickly.
- Well-crafted Template with instant download facility.
- Crisp and elegant font style.
- The best Template with attractive nodes


You May Also Like These PowerPoint Templates
Add to Wishlist
Download
Edit

Add to Wishlist
Download
Edit

Add to Wishlist
Download
Edit

Add to Wishlist
Download
Edit

Add to Wishlist
Download
Edit

Add to Wishlist
Download
Edit

Add to Wishlist
Download
Edit

Add to Wishlist
Download
Edit


Add to Wishlist
Download
Edit


Add to Wishlist
Download
Edit


Add to Wishlist
Download
Edit

Add to Wishlist
Download
Edit

Add to Wishlist
Download
Edit

Add to Wishlist
Download
Edit
