Data-driven PowerPoint Template and Google Slides Themes

Data driven slide with layered concentric circles displaying percentages on an orange gradient.
P.ID : 34703
    249 views
    24 Downloads
    Get Custom Slides by Experts
    Instantly Access Templates in PowerPoint

    Data-driven PowerPoint Template and Google Slides Themes


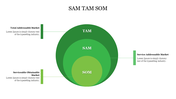
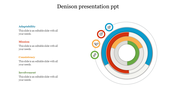
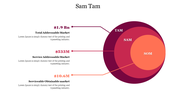
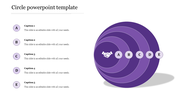
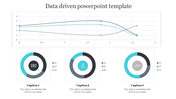
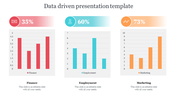
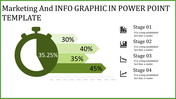
    The Data-Driven PowerPoint template and Google Slides theme feature a circle diagram divided into slices, with each slice labeled with a percentage. This type of graph, known as a pie chart or cycle graph, visually represents the proportional parts of a whole.

    Circle diagrams are widely used in infographics and presentations because they are easy to read and understand. They provide a clear visual representation of data, making complex information more accessible to the audience.

    With its clean and modern design, this template offers a professional and visually appealing way to present data-driven content. Whether you're showcasing sales figures, market share, or demographic data, the Data-Driven template provides a versatile platform for communicating your message effectively.

    Fully customizable, users can adjust colors, fonts, and layout elements to suit their specific needs and preferences. Whether used for business reports, academic presentations, or marketing pitches, the Data-Driven template offers a comprehensive and impactful tool for presenting data-driven insights.

    Features of the template

    • 100% customizable slides and easy to download.
    • Slides are available in different nodes & colors.
    • The slide contains 16:9 and 4:3 formats.
    • It is easy to change the colors of the slide quickly. 
    • Well-crafted template with an instant download facility.
    Advertisement

    You May Also Like These PowerPoint Templates

    Add to Wishlist
    Download
    AI Customize
    Slide featuring a colorful concentric circle with icons and captions, illustrating a concept visually.
    Free
    Add to Wishlist
    Download
    AI Customize
     Multi-layered circular report chart with green, yellow, blue, and gray segments, each connecting to a caption areas.
    Add to Wishlist
    Download
    AI Customize
    Layered onion diagram slide with five colored concentric circles numbered 1 to 5, each with labeled captions on the sides.
    Free
    Add to Wishlist
    Download
    AI Customize
    Concentric circles diagram with four colorful rings, showcasing captions in each segment with a trophy icon in the center.
    Free
    Add to Wishlist
    Download
    AI Customize
    Onion diagram slide with four colored concentric circles representing hierarchical data, accompanied by text placeholders.
    Add to Wishlist
    Download
    AI Customize
    Three concentric circles in varying shades of blue with corresponding labels and text on the right.
    Free
    Add to Wishlist
    Download
    AI Customize
    Attractive Denison Model PPT Template For Presentation
    Add to Wishlist
    Download
    AI Customize
    Layered circles in a gradient onion model, each labeled 01 to 05 with title areas in a white background.
    Free
    Add to Wishlist
    Download
    AI Customize
    Onion-shaped circular diagram with four colored rings and numbers, each layer linked to caption areas.
    Add to Wishlist
    Download
    AI Customize
    Multicolored concentric circles  in green, orange, blue, and red, with icons, and corresponding labels on the left.
    Add to Wishlist
    Download
    AI Customize
    Onion chart with four concentric layers in shades of red, each layer labeled with placeholder text connected by lines.
    Add to Wishlist
    Download
    AI Customize
    Layered circular infographic with four colored sections, each labeled with an icon and caption, and a central lightbulb icon.
    Free
    Add to Wishlist
    Download
    AI Customize
    Isometric PowerPoint template featuring a layered circular diagram with four labeled text boxes connected by lines.
    Free
    Add to Wishlist
    Download
    AI Customize
    A layered gray circle diagram with five segments labeled A to E, with corresponding text placeholders on the left.
    Add to Wishlist
    Download
    AI Customize
    Progress chart PowerPoint slide displaying four sections with different completion percentages with captions.
    Add to Wishlist
    Download
    AI Customize
    Concentric circles with teal, blue, red, and orange colors in the center, surrounded by four icons and text placeholders.