Free - The Best Free Cause and Effect PowerPoint Template Slides

Free
Grey template showcasing cause and effect relationships in three numbered boxes with connecting lines and placeholders.
P.ID : 43882
    487 views
    190 Downloads
    Get Custom Slides by Experts
    Instantly Access Templates in PowerPoint

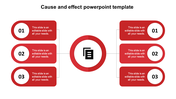
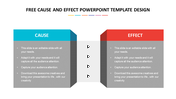
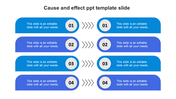
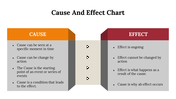
    Capturing Cause And Effect Template

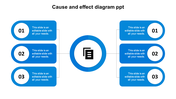
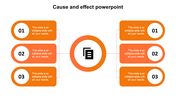
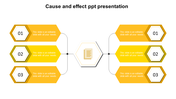
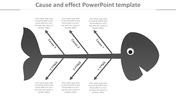
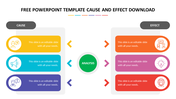
    A Cause-and-Effect Diagram is an instrument that identifies, sorts, and displays probable causes of a specific problem. In a business presentation, dramatic representation is the leading way of immersing your points into the client's mind without any hindrance. You can discuss the cause and effect of a problem in businesses or any other field. The chart here consists of 6 nodes split up as 3 for causes and other 3 for effect. The cost surprises you, for it is free to all users. You can get this without any effort from your side. So make sure to check out this template, for it has many benefits.

    Features of this template

    • 100% customizable slides and easy to download
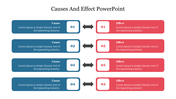
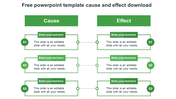
    • Slides are available in different nodes & colors.
    • The slides contained 16:9 and 4:3 formats.
    • Easy to change the slide colors quickly.
    • Well-crafted template with an instant download facility.
    • An engrossing professional diagram.
    • Free template.
    Advertisement

    You May Also Like These PowerPoint Templates

    Add to Wishlist
    Download
    AI Customize
    Circular cause and effect diagram with six icons connected around a central circle, featuring various colors.
    Free
    Add to Wishlist
    Download
    AI Customize
    Cause and effect slide with three steps showing linked boxes for cause and effect on a blue theme with placeholder text.
    Add to Wishlist
    Download
    AI Customize
    Central blue circle with cause in orange on left, effects in red on right, linked by dotted lines in concept map.
    Add to Wishlist
    Download
    AI Customize
    A slide diagram linking causes on the left to effects on the right, is divided into four colored captions.
    Add to Wishlist
    Download
    AI Customize
    Cause and effect PowerPoint template with two hexagons, showing cause on the left and effect on the right, linked by arrows.
    Add to Wishlist
    Download
    AI Customize
    Cause and effect PowerPoint slide with three rows of paired text boxes and icons in orange, blue, and red colors.
    Add to Wishlist
    Download
    AI Customize
    Fishbone diagram with six colorful labels and arrows pointing to the spine, representing causes leading to an effect.
    Add to Wishlist
    Download
    AI Customize
    Colorful cause and effect diagram slide featuring text sections and arrows indicating relationships with placeholder text.
    Free
    Add to Wishlist
    Download
    AI Customize
    Slide featuring an orange cause and effect template with four rows, each showing numbered steps and connecting arrows.
    Add to Wishlist
    Download
    AI Customize
    Fishbone cause and effect diagram with labeled causes and effects for problem solving analysis.
    Free
    Add to Wishlist
    Download
    AI Customize
    Cause and effect PowerPoint template with three causes on each side leading to a central effect.
    Free
    Add to Wishlist
    Download
    AI Customize
    Cause and effect slide with six purple arrows leading to a grey fish bone diagram, showing multiple option.
    Add to Wishlist
    Download
    AI Customize
    Structured layout featuring four rows of paired colored circles and corresponding gray text boxes on a white background.
    Add to Wishlist
    Download
    AI Customize
    Cause and effect diagram PowerPoint template showing primary and secondary causes leading to a central effect.
    Free
    Add to Wishlist
    Download
    AI Customize
    Diagram illustrating cause and effect in a looped structure, with numbered sections in blue circles and text on each side.
    Free
    Add to Wishlist
    Download
    AI Customize
    Template for cause and effect featuring four yellow sections with numbered points and space for text.
    Add to Wishlist
    Download
    AI Customize
    Four circular progress charts in yellow, blue, orange, and pink above text boxes, showcasing percentage values.