Effective Ways of Analysis PowerPoint Template Designs

Green oval infographic with sections for Job, Semen, and Data, accompanied by icons and descriptions.
P.ID : 27390
    94 views
    1 Downloads
    Get Custom Slides by Experts
    Instantly Access Templates in PowerPoint

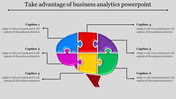
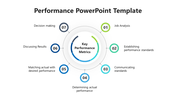
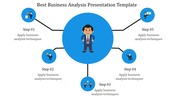
    Analysis PowerPoint Presentation Template

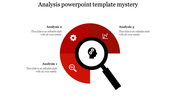
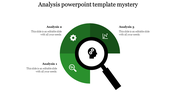
    Welcome to our Analysis PowerPoint Template, where clarity meets curiosity. Here’s what you’ll find: Central Element: A captivating central graphic – a web of interconnected nodes – symbolizing the intricate relationships within data. Data Points: Each node represents a data point, a puzzle piece waiting to fit into the bigger picture. Subtle Color Palette: Shades of blue and gray evoke professionalism and focus.

    Editable Text Boxes: Beneath the nodes, editable text boxes await your insights. Label them with key findings, trends, or hypotheses. This template is perfect for anyone who needs to create a presentation, including Professionals, business proposals, marketing pitches, sales presentations, Educators, Students, Entrepreneurs, and Startups. Click below to explore and download our Templates and Google Slides Themes now.

    Features of the template:

    •  Slides are available in 4:3 & 16:9
    • Well-crafted template with instant download.
    • Get slides that are 100% customizable and easy to download
    Advertisement

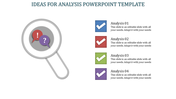
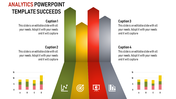
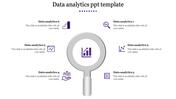
    You May Also Like These PowerPoint Templates

    Add to Wishlist
    Download
    AI Customize
    Competitor analysis presentation slide featuring progress bars with business building background with placeholder text.
    Add to Wishlist
    Download
    AI Customize
    The Best Situation Analysis Template Slide Presentation
    Add to Wishlist
    Download
    AI Customize
    Dark themed slide featuring analytics elements, including a magnifying glass, mobile device, and percentages in bold.
    Add to Wishlist
    Download
    AI Customize
    Slides featuring Venn diagrams and flowcharts in blue, purple, and orange, explaining diversity, equity, and inclusion.
    Add to Wishlist
    Download
    AI Customize
    Financial analysis slide with icons of coins, hand with cash, transaction, and refund on clipped sheets.
    Add to Wishlist
    Download
    AI Customize
    Easily Usable Performance PPT And Google Slides Template
    Add to Wishlist
    Download
    AI Customize
    Six pie analysis charts in blue, red, orange, green, teal, and purple, displaying percentages from 15% to 90%.
    Add to Wishlist
    Download
    AI Customize
    A colorful risk analysis matrix slide chart, displaying low, medium, high, and extreme risk levels in a grid format.
    Add to Wishlist
    Download
    AI Customize
    Linear timeline showing red triangular nodes connected by dots, each node containing an icon and caption.
    Add to Wishlist
    Download
    AI Customize
    Attractive Business Analytics PowerPoint Template Design
    Add to Wishlist
    Download
    AI Customize
    A person working on a laptop with analysis data, alongside bar charts with percentage and text box, on a gray background.
    Add to Wishlist
    Download
    AI Customize
    Circular waffle chart with segmented colored sections in blue, orange, teal, and red, representing percentage values.
    Add to Wishlist
    Download
    AI Customize
    Analytics slide with line graph, pie chart, and statistics showing 13M views, 13M active subscribers, and 991K subscribers.
    Add to Wishlist
    Download
    AI Customize
    Financial slide with golden globes for two countries, featuring coin stacks next to one, with blue percentage bars below.
    Add to Wishlist
    Download
    AI Customize
    Analysis presentation slide showing a technology growth chart with percentage values and icons with placeholder text.
    Free
    Add to Wishlist
    Download
    AI Customize
    Best Scenario Analysis Presentation Template Slides
    Add to Wishlist
    Download
    AI Customize
    Financial analysis slide with a bold 40% statistic, a financial overview section, and a businessperson pointing.