Free - Make Use Of Our Data Drive Presentation Templates
Free

 Canva
Canva


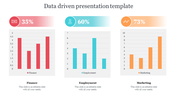


Data Drive PowerPoint Template and Google Slides Themes
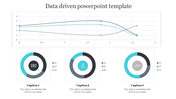
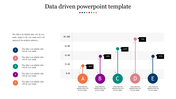
Reveal the "Data Drive" PowerPoint Template and Google Slides Themes, a free resource that serves as a beacon of insight in the world of data-driven analytics. With ten nodes artfully embedded in the mountainous terrain of graph design, this template offers a visually captivating journey. Each node features compelling captions, title holders, and expansive text areas, making it ideal for analysts, marketers, and educators aiming to convey complex data stories with clarity and sophistication. Seamlessly integrate your data narratives with Drive, empowering your audience to explore and engage. This template is more than just a presentation tool; it's a catalyst for dynamic storytelling. Improve your data presentations today with Drive's intuitive design and seamless integration, and download to embark on a new era of visual communication mastery.
Features of the Template
- 100 % customizable slides.
- The slide show is in 4:3, 16:9, zip format.
- There is powerful connectivity with Google Slides and PowerPoint.
- It is simple and quick to alter the slide's color.
- An efficient template that can be easily accessed immediately.
- Well-crafted template with an instant download facility.


You May Also Like These PowerPoint Templates

Add to Wishlist
Download
Edit

Add to Wishlist
Download
Edit


Add to Wishlist
Download
Edit

Add to Wishlist
Download
Edit

Add to Wishlist
Download
Edit

Add to Wishlist
Download
Edit

Add to Wishlist
Download
Edit

Add to Wishlist
Download
Edit

Add to Wishlist
Download
Edit

Add to Wishlist
Download
Edit


Add to Wishlist
Download
Edit


Add to Wishlist
Download
Edit


