Difference Between Leader And Manager PPT And Google Slides

Comparison slide showing key differences between a leader and a manager, with contrasting points in colored boxes.
P.ID : 69410
    1.1K+ views
    157 Downloads
    Get Custom Slides by Experts
    Instantly Access Templates in PowerPoint

    Difference Between Leader And Manager Presentation Slide


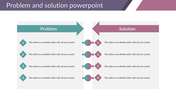
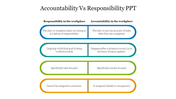
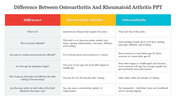
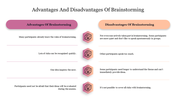
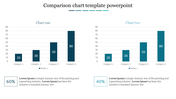
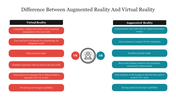
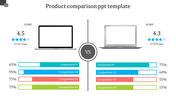
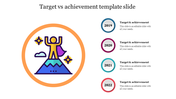
    Unlock the secrets of effective leadership and management in organizational behavior with our engaging Difference Between Leader And Manager PowerPoint presentation. This insightful resource delves deep into the differences between leaders and managers, highlighting key distinctions essential for organizational success. Our presentation features a visually compelling table illustrating these distinctions, making complex concepts easy to grasp. Explore this dynamic resource, designed to captivate and educate your audience. Download our Difference Between Leader And Manager template now, and empower your team to become the transformative leaders your organization needs. Start your journey towards leadership excellence today!

    Features of the template

    • 100% customizable slides and easy to download.
    • Slides are available in different colors
    • The slide has 4:3 and 16:9 formats.
    • Easy to change the slide colors quickly.
    • Appealing Presentation to impress an audience.
    • Create feature-rich slide presentations. 
    • An eye-pleasing color slide helps to give a catchy display.
    • It is capable with PPT and Google Slides.
    Advertisement

    You May Also Like These PowerPoint Templates

    Add to Wishlist
    Download
    AI Customize
    Comparison slide layout with space for text on either side and five colorful icons aligned in the middle.
    Add to Wishlist
    Download
    AI Customize
    A slide showing a contrast between hard work and smart work, with steps in different colors, a text area, and an icon.
    Add to Wishlist
    Download
    AI Customize
    Comparison map slide showing data for the U.S. and Brazil, with 67% female and 33% male with colorful icons and data.
    Free
    Add to Wishlist
    Download
    AI Customize
    Seesaw illustration with a feather and a bucket, showing directional arrows in purple and orange.
    Add to Wishlist
    Download
    AI Customize
    Visual infographic slide showing a comparison of two project names, each with a list of associated features and text area.
    Add to Wishlist
    Download
    AI Customize
    Comparison slide showing male and female icons with percentages, 45% for men and 75% for women.
    Add to Wishlist
    Download
    AI Customize
    Two sections with blue boxes for upselling and yellow for cross selling on the right, and a circle in the center.
    Add to Wishlist
    Download
    AI Customize
    Comparison slide between artificial intelligence and machine learning, with key differences listed in two side-by-side boxes.
    Add to Wishlist
    Download
    AI Customize
    Comparison table with two columns one with a red X for incorrect and another with a green checkmark for correct items.
    Add to Wishlist
    Download
    AI Customize
    Four pairs of horizontal arrows in orange, blue, yellow, and green with numbered boxes in the center, aligned vertically.
    Free
    Add to Wishlist
    Download
    AI Customize
    Colorful cause and effect diagram slide showing causes and effects and analysis in the center with icons and text area.
    Add to Wishlist
    Download
    AI Customize
    Two half circle diagrams in pink and orange with labeled models, each with four captions on both sides.
    Free
    Add to Wishlist
    Download
    AI Customize
    Comparison chart slide displaying three options, each with four numbered sections for comparing features or categories.
    Add to Wishlist
    Download
    AI Customize
    Comparison slide with four rows of green and blue text boxes, connected by numbered circular segments in the center.
    Add to Wishlist
    Download
    AI Customize
    Yin and yang diagram with red and blue halves, featuring handshake and coin icons, and captions on either side.
    Add to Wishlist
    Download
    AI Customize
    World map comparison slide with regional demographics showing 80% female and 20% male distribution across continents.
    Add to Wishlist
    Download
    AI Customize
    Leadership Vs Management PPT Template and Google Slides