Free - Get The Best Data Driven PowerPoint Templates For Presentation

Free
Data driven template showing percentage values for various categories represented by gray, bell shaped graphs.
P.ID : 36372
    35 views
    13 Downloads
    Get Custom Slides by Experts
    Instantly Access Templates in PowerPoint

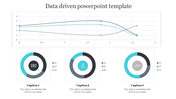
    Data Driven Presentation Template


    In today’s data-driven world, presenting complex information clearly and effectively is crucial. Our "Data-Driven PowerPoint Templates" are designed to help you transform raw data into insightful and visually appealing presentations, making your points both compelling and easy to understand.

    Slide Description:

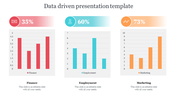
    Our template features a bar graph with ten categories, each represented by a bell curve. The categories (from left to right) are Profit Model to Customer Engagement. Corresponding percentage values are displayed above each category: 50% to 63%.

    Purpose of this slide:

    To present quantitative data in a visually accessible format. Bell curves likely indicate distribution or variance around the measured percentages. It simplifies complex data for analysis or decision-making during presentations.

    Who can benefit?

    Business professionals, analysts, and strategists can benefit from this template. Anyone needing clear visual aids to communicate performance metrics across different business aspects.

    Download our templates today and take your data presentations to the next level. 

    Features of the template:


    •  Slides are available in 4:3 & 16:9
    • Get slides that are 100% customizable and easy to download
    • Highly compatible with PowerPoint and Google Slides
    Advertisement

    You May Also Like These PowerPoint Templates

    Free
    Add to Wishlist
    Download
    AI Customize
    Data Driven PowerPoint Templates and Google Slides
    Add to Wishlist
    Download
    AI Customize
    Five colored sections in green , orange, purple, yellow, and teal, showing different marketing strategies in a row.
    Add to Wishlist
    Download
    AI Customize
    Slide featuring a histogram chart with orange bars across seven categories, presented on a white background.
    Free
    Add to Wishlist
    Download
    AI Customize
    A graph showing various business aspects with percentages for each from profit model to customer engagement on a blue theme.
    Add to Wishlist
    Download
    AI Customize
    Data driven marketing slide illustrating a circular process with four steps harvest, analyze, activate, and optimize.
    Add to Wishlist
    Download
    AI Customize
    A colorful bar graph showing data driven insights with categories along with their corresponding percentages.
    Add to Wishlist
    Download
    AI Customize
    Data driven slides featuring various data visualizations, including charts and graphs with different colored layout designs.
    Add to Wishlist
    Download
    AI Customize
    Data driven slide featuring a colorful chart with percentage values, showing a timeline from 4m to 6m with placeholder text.
    Add to Wishlist
    Download
    AI Customize
    Data driven slide displaying five key areas on a colorful circle with icons and text description.
    Free
    Add to Wishlist
    Download
    AI Customize
    Preventive maintenance illustration featuring yellow peaks with icons and labels for different stages.
    Add to Wishlist
    Download
    AI Customize
    Four step process for data driven marketing with color coded text boxes and description.
    Free
    Add to Wishlist
    Download
    AI Customize
    Bar chart with overlapping orange and peach shades depicting percentages for various categories on a white background.
    Add to Wishlist
    Download
    AI Customize
    Diagram showing percentages for date driven financing, marketing, teamwork, and scheduling, with icons and a radar chart.
    Free
    Add to Wishlist
    Download
    AI Customize
    Drive presentation slide showing layered area chart with metrics from profit model to customer engagement on a purple theme.
    Free
    Add to Wishlist
    Download
    AI Customize
    Red gradient mountain peak shapes on a white layout, showing varied heights for percentage data analysis.
    Free
    Add to Wishlist
    Download
    AI Customize
    Drive business presentation slide with a yellow line graph displaying varying percentages for ten key business categories.
    Free
    Add to Wishlist
    Download
    AI Customize
    Drive presentation template with orange gradient bell curves representing data percentages, on a red footer section.