Innovative Business Plan PPT Template For Presentation

A business plan template with a laptop, magnifying glass, and bar graph with icons and captions.
P.ID : 22613
    13 slides
    Infographic detailing key phases of customer profitability analysis slide deck with icons and color-coded segments.
    16 slides
    Customer Value Proposition triangle diagram PPT slides with different layout designs and icons with text descriptions.
    16 slides
    A pack of slides with a colorful SCQA framework illustrating icons with visual charts and layouts.
    13 slides
    Analysis PowerPoint Presentation And Google Slides Themes
    149 views
    5 Downloads
    Get Custom Slides by Experts
    Instantly Access Templates in PowerPoint

    Azure Theme Business Plan PPT Slide

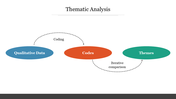
    Just because you framed a good business plan doesn't mean it will happen. Right? Execution and presentation have the next crux of the matter. But it's an uphill battle to find the perfect slide for business and planning presentations. But it is a cinch to find and build amazing PPTs with our Impressive Business Plan PPT Template. Another exciting feature is the three nodes with huge text space that makes your data more detailed. So, download now to grab your appreciation.

    Features of the template

    • 100% customizable slides and easy to download.
    • Slides are available in different nodes & colors.
    • The slide contained 16:9 and 4:3 formats.
    • Easy to change the slide colors quickly.
    • Well-crafted template with instant download facility.
    • Spacious nodes and text inserted.
    • Vibrant blue-themed template.
    Advertisement

    You May Also Like These PowerPoint Templates

    Free
    Add to Wishlist
    Download
    AI Customize
    Download Financial Analysis PowerPoint Presentation
    Add to Wishlist
    Download
    AI Customize
    Dupont analysis overview slides illustrating the calculation of profit margin with different layout designs with icons.
    Add to Wishlist
    Download
    AI Customize
    Current state analysis slide comparing cost reduction and value creation strategies with two colored boxes and text caption.
    Add to Wishlist
    Download
    AI Customize
    An infographic showing three stages of a research paradigm in red, orange and green in hexagon shape each with icons.
    Add to Wishlist
    Download
    AI Customize
    A reflective learning process slide shows four stages each in colorful boxes with text descriptions.
    Add to Wishlist
    Download
    AI Customize
    Grid of various plot diagram slides showcasing narrative arcs, with labels for different stages of a plot's progression.
    Add to Wishlist
    Download
    AI Customize
    RCA diagram with a gray section and four colored text box in orange, purple, blue, and yellow on the right.
    Add to Wishlist
    Download
    AI Customize
    Simple Moscow Method PowerPoint Slide Template
    Add to Wishlist
    Download
    AI Customize
    Five-segment RATER model with colored circles representing service quality factors and placeholder text around each
    Add to Wishlist
    Download
    AI Customize
    Slide deck showcasing ratio analysis elements with colorful geometric designs and icons, highlighting financial metrics.
    Add to Wishlist
    Download
    AI Customize
    Slide illustrating win and loss analysis with red and green arrows along with four key step icons and text descriptions.