Business Analytics PPT Template for Data-Driven Decisions

Four colorful rectangular blocks with numbered shadow effects, using orange, red, pink, and green colors.
P.ID : 14626
    9 slides
    An infographic showing three stages of a research paradigm in red, orange and green in hexagon shape each with icons.
    13 slides
    Grid of various plot diagram slides showcasing narrative arcs, with labels for different stages of a plot's progression.
    13 slides
    Slide deck showcasing ratio analysis elements with colorful geometric designs and icons, highlighting financial metrics.
    227 views
    10 Downloads
    Get Custom Slides by Experts
    Instantly Access Templates in PowerPoint

    Unleash Data Insights with Our Business Analytics Template


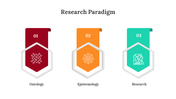
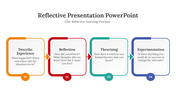
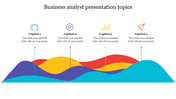
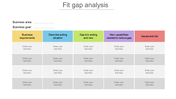
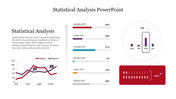
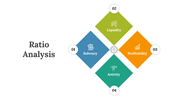
    Business analytics is essential for informed decision-making and strategic planning. Our Business Analytics PowerPoint Template and Google Slides Themes help you analyze and present data effectively. Featuring four customizable text boxes, each accompanied by a caption and text area, this template boasts a vibrant multicolor theme that enhances visual appeal.

    Business professionals, data analysts, consultants, and educators can leverage this template to convey complex analytics concepts with clarity and precision. Whether you're exploring sales trends, forecasting market demand, or evaluating performance metrics, our template equips you with the resources to communicate insights seamlessly.

    Features of the template


    • 100% customizable slides are easy to download.
    • Slides are available in different colors.
    • The slide has 4:3 and 16:9 formats.
    • It is easy to change the slide colors quickly.
    • It has a cute design to impress an audience.
    • Create feature-rich, animated presentations.
    Advertisement

    You May Also Like These PowerPoint Templates

    Add to Wishlist
    Download
    AI Customize
    Slide deck covering hypothesis testing, with a central six-step process diagram and supporting slides in a white background.
    Add to Wishlist
    Download
    AI Customize
    3C analysis slides with various triangle shaped layouts in vibrant colors representing company, customers, and competitors.
    Add to Wishlist
    Download
    AI Customize
    VRIO table in red and orange hues, featuring rows for value, rare, inimitable, and organized with yes and no in columns.
    Add to Wishlist
    Download
    AI Customize
    Feasibility Analysis Template Design Presentation Slide
    Add to Wishlist
    Download
    AI Customize
    Curved arrow stack analysis diagram with various icons and colors representing stages.
    Add to Wishlist
    Download
    AI Customize
    Four tear drop quadrants in blue, orange, green, and yellow, each with circular accents, representing moscow analysis.
    Add to Wishlist
    Download
    AI Customize
    Pareto Analysis PowerPoint And Google Slides Template
    Add to Wishlist
    Download
    AI Customize
    Job analysis table with colorful sections in red, green, yellow, blue, and teal, displaying details and requirements
    Add to Wishlist
    Download
    AI Customize
    Data analysis slides with flowcharts, icons, and colored segments for statistical methods and machine learning algorithms.
    Add to Wishlist
    Download
    AI Customize
    Four stacked, tilted rectangles in purple, blue, green, and red, each showing steps in hazard analysis and risk assessment.
    Add to Wishlist
    Download
    AI Customize
    GROW Coaching Model PPT Presentation And Google Slides
    Add to Wishlist
    Download
    AI Customize
    Lead time analysis PPT slide illustrating the process with three key elements and icons.
    Add to Wishlist
    Download
    AI Customize
    The research methodology slide features a central magnifying glass connected by six colorful icons with text area.
    Add to Wishlist
    Download
    AI Customize
    Collection of slides showing different styles like diamonds, hexagons, and flowcharts, with ethical principles.