Business Analytics PowerPoint with Zig-zag Model

PowerPoint slide with business analytics template featuring five red arrows and text captions.
P.ID : 6390
    13 slides
    Content Analysis PowerPoint And Google Slides Themes
    11 slides
    Organizational assessment slide deck highlighting mission at the center, surrounded by four elements with level indicators.
    11 slides
    Customer analytics slide deck with five diamond icons representing steps from customer experience to data collection.
    316 views
    4 Downloads
    Get Custom Slides by Experts
    Instantly Access Templates in PowerPoint

    Business Analytics PowerPoint Template


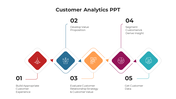
    Uncover the power of data with our business analytics PowerPoint template. This dynamic visual toolkit showcases key performance indicators, trends, and analytical findings, making your business analytics presentation impactful. It is designed to illuminate insights, strategies, and growth opportunities, transforming complex data into a clear and visually compelling story.


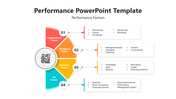
    Whether you're analyzing market trends, financial data, or operational metrics, this template is your go-to tool. It features five nodes with text boxes, creating a zig-zag model that aligns your focus with clarity. The serene grey background enhances readability, allowing you to find your text easily and making it more understandable.


    Customizable elements and a modern design ensure your audience comprehends the data-driven narrative with clarity and precision. Don't wait! Download now to uncover the potential of your data, impress your stakeholders, and elevate your presentation communication effectively.


    Features of the template

    • 100% customizable slides and easy to download.
    • Slides are available in different nodes & colors.
    • The slide contains 16:9 and 4:3 formats.
    • It is easy to change the colors of the slide quickly.
    • Well-crafted template with an instant download facility.

    Advertisement

    You May Also Like These PowerPoint Templates

    Add to Wishlist
    Download
    AI Customize
    Investigative journalism template featuring a magnifying glass on a laptop keyboard, with placeholder text areas.
    Add to Wishlist
    Download
    AI Customize
    Analytics slide showcasing industrial buildings and two progress bars highlighting techniques with corresponding percentages.
    Add to Wishlist
    Download
    AI Customize
    Customer Profitability Analysis PPT And Google Slides
    Add to Wishlist
    Download
    AI Customize
    Financial analysis slide with six green arrows pointing to a central diamond featuring a cash and coins graphic.
    Add to Wishlist
    Download
    AI Customize
    Slide featuring a cost benefit analysis table, displaying types descriptions alongside an image of hands holding cash.
    Add to Wishlist
    Download
    AI Customize
    Four blue and white sections for web analytics uses, featuring icons and text placeholders.
    Add to Wishlist
    Download
    AI Customize
    Project prioritization using the Moscow technique, with four sections with placeholder text.
    Add to Wishlist
    Download
    AI Customize
    Business analysis layout with three numbered hexagon steps and a photo of a business meeting on a dark blue background.
    Add to Wishlist
    Download
    AI Customize
    Slide deck outlining the performance evaluation process, with icons and hexagonal shapes depicting key steps.
    Add to Wishlist
    Download
    AI Customize
    Financial analysis chart displaying production and sales growth from 2016 to 2019 on a red toned background.
    Add to Wishlist
    Download
    AI Customize
    Force field analysis slide displaying driving forces on the left and restraining forces on the right with problem statement.
    Add to Wishlist
    Download
    AI Customize
    A blue and gray SWOT matrix displaying the strategy details with a descriptive box on the right.
    Free
    Add to Wishlist
    Download
    AI Customize
    Business analysis diagram with a hexagon featuring a magnifying glass icon, connected to six colored steps on both sides.
    Add to Wishlist
    Download
    AI Customize
    Slide featuring five colorful cylindrical bar charts labeled with data analytics categories with percentages from 23% to 75%.
    Add to Wishlist
    Download
    AI Customize
    Colorful horizontal layout with arrows in turquoise, purple, red, and orange, showcasing a value chain structure.
    Add to Wishlist
    Download
    AI Customize
    Four rectangular blocks in purple, red, blue, and green displaying text with circular icons on the left.
    Add to Wishlist
    Download
    AI Customize
    Slide with three green sections in a vertical layout, each featuring icons for traffic, behavior tracking, and optimization.
    Free
    Add to Wishlist
    Download
    AI Customize
    Target audience analysis featuring cable, satellite, and digital bars, alongside a bullseye and two figures analyzing data.
    Add to Wishlist
    Download
    AI Customize
    Four colored analysis circles with icons of data charts, computer screen, bar graphs, and gears, analysis with caption areas.