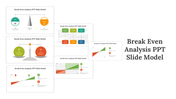
Top-Notch Break Even Point Template Design For Your Need


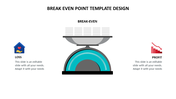
Two Noded Break Even Analysis PowerPoint Slide
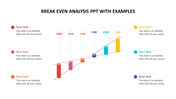
Download this Break Even Point Template Design PPT Slide with creative infographic designs to present your break-even analysis. It is an excellent financial presentation tool that helps to analyze the profits and losses. It is the best analytical tool that will help you design professional-looking presentations. It is also 100% editable. Hurry to grab!
About the template:
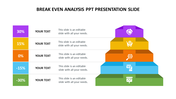
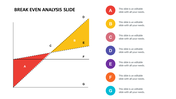
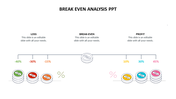
The Break Even Point Template Design PPT Slide is a creative two-noded template. It has a scale at the center of the slide to show the break-even. It has two nodes with infographic images to present loss and profit. It has enough text holders to present your findings. It has a well-organized layout that will make your presentation easy to follow. Visit our site to find more professional PowerPoint templates.
Features of this template:
1. 100% customizable slides and easy to download.
2. Slides available in different nodes & colors.
3. The slide contained 16:9 and 4:3 formats.
4. Easy to change the slide colors quickly.
5. Well-crafted template with instant download facility.
6. It has a neat and clear layout.


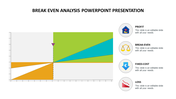
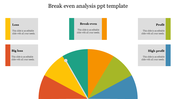
You May Also Like These PowerPoint Templates
Add to Wishlist
Download
Edit

Add to Wishlist
Download
Edit

Add to Wishlist
Download
Edit

Add to Wishlist
Download
Edit

Add to Wishlist
Download
Edit


Add to Wishlist
Download
Edit


Add to Wishlist
Download
Edit

Add to Wishlist
Download
Edit

Add to Wishlist
Download
Edit

Add to Wishlist
Download
Edit

Add to Wishlist
Download
Edit


Add to Wishlist
Download
Edit

Add to Wishlist
Download
Edit

Add to Wishlist
Download
Edit

Add to Wishlist
Download
Edit

Add to Wishlist
Download
Edit
