Analysis of PowerPoint Presentation and Google Slides

Analysis slide with two circles, one showing a growth bar chart and the other a declining line graph, surrounded by four icons.
P.ID : 13661
    220 views
    6 Downloads
    Get Custom Slides by Experts
    Instantly Access Templates in PowerPoint

    Analysis of PowerPoint Presentation and Google Slides

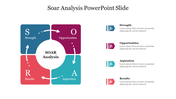
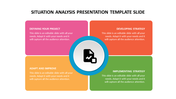
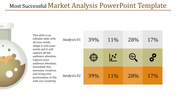
    The "Analysis PowerPoint Presentation" template features a visually appealing design suitable for presenting analytical data and insights. The image showcases a slide template with a blue and orange color scheme. At the center of the slide is a large circle divided into two sections: a blue section with a graph icon on the left and an orange section with a settings icon on the right. Surrounding the central circle are four smaller circles, each containing a different icon, arranged circularly.

    This template is ideal for individuals and professionals across various fields who need to present analysis reports, statistical findings, or strategic insights. Business analysts, data scientists, consultants, and project managers can utilize this template to convey complex information clearly and concisely.

    The template is available in "16:9" and "4:3" formats and zip files for easy sharing and distribution. It's a free and fully customizable template, allowing users to personalize it according to their specific presentation needs and preferences. Download this versatile template now.
    Advertisement

    You May Also Like These PowerPoint Templates

    Add to Wishlist
    Download
    AI Customize
    A business analytics PowerPoint slide with icons surrounding a magnifying glass and a book with captions on a dark theme.
    Add to Wishlist
    Download
    AI Customize
    Finance-themed slide with an orange balance scale graphic and donut charts showing different percentages on the left.
    Free
    Add to Wishlist
    Download
    AI Customize
    Three vertical capsule shaped charts in pink, gray, and red on a dark background, with a large orange arrow at the bottom.
    Add to Wishlist
    Download
    AI Customize
    Growth analysis PowerPoint template with four steps and a computer showing bar chart analysis.
    Add to Wishlist
    Download
    AI Customize
    Infographic design featuring a magnifying glass lens divided into four quadrants, each representing a type of analysis.
    Add to Wishlist
    Download
    AI Customize
    Root cause analysis slide with a tree diagram and four labeled colored boxes on branches, with three captions at the bottom.
    Free
    Add to Wishlist
    Download
    AI Customize
    Map-based analysis design with statistical data visuals including circular graphs and demographic distributions.
    Add to Wishlist
    Download
    AI Customize
    Circular infographic with a central globe icon connected to eight color-coded nodes for analytics techniques.
    Free
    Add to Wishlist
    Download
    AI Customize
    Colorful radial design with six segments around a red analysis icon, highlighting key analytics strategies.
    Add to Wishlist
    Download
    AI Customize
    Five colorful oval shapes in blue, green, red, orange, and teal, with shadow effects, featuring icons and captions inside.
    Add to Wishlist
    Download
    AI Customize
    Side-by-side Pareto analysis blocks with 20% and 80% sections, representing complaints and reasons in contrasting colors.
    Add to Wishlist
    Download
    AI Customize
    Four colorful arrow shapes in yellow, blue, purple, and orange, each containing a letter and text below.
    Add to Wishlist
    Download
    AI Customize
    Capabilities analysis template featuring color coded categories on the left and a circular percentage chart on the right.
    Add to Wishlist
    Download
    AI Customize
    Circular diagram with four segments in yellow, green, blue, and teal, each containing icons around a white central circle.
    Add to Wishlist
    Download
    AI Customize
    Use Performance PowerPoint And Google Slides Template