Predesigned Analysis PPT and Google Slides Themes
Get Custom Slides by Experts
Enhance Your Presentations with Add-ins
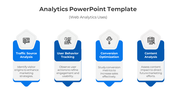
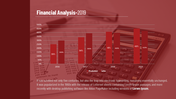
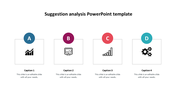
Analysis PowerPoint Template
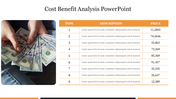
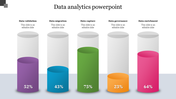
Represent the data and insights of your business and marketing by introducing our Analysis PowerPoint Template. The slide comes with a colorful and simple graph. It showcases a bar chart with varying values presented as percentages. This graph provides a clear overview of trends and progress over consecutive years.
Ideal for presenting financial data, market analysis or performance metrics. Suitable for analysts, financial professionals, consultants and business leaders. An apt template for delivering a boardroom presentation, a client pitch or a project update. Download now to enable your target audience to grasp key insights at a glance.
Features of the template
- The slide contains 16:9 and 4:3 formats.
- Compatible with Google slide themes and PowerPoint.
- 100% customizable slides and easy to download.
- It is easy to change the colors of the slide quickly.
- Well-crafted template with an instant download facility.
You May Also Like These PowerPoint Templates


 Canva
Canva


