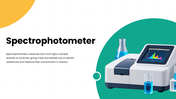
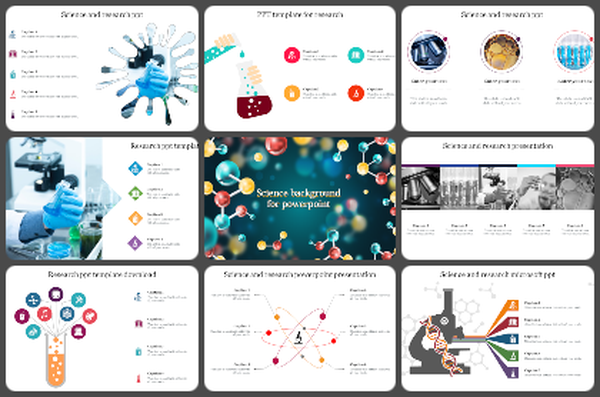
Ever wondered how a lab can tell how much DNA is in a tiny drop of liquid? The answer is light, and this spectrophotometer template helps you explain it in a simple, friendly way, whether you’re teaching a class, training lab staff, or presenting a science project. Browse more science research PowerPoint templates if you need other lab and research topics for your deck.
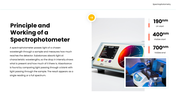
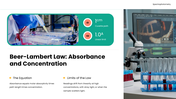
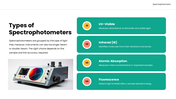
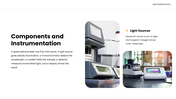
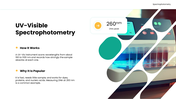
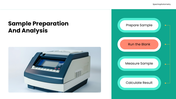
The slides show how a spectrophotometer passes light through a sample and measures how much is absorbed, which tells you what’s in it and how much there is. You can explain the Beer-Lambert Law in plain language, compare the main types of spectrophotometers, such as UV-Visible, infrared, atomic absorption, and fluorescence, and walk through the five main parts of the instrument. A UV-Vis slide covers one of the most popular methods, and a simple step-by-step layout shows how to prepare, measure, and calculate results.
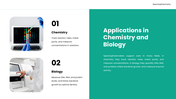
To connect it to real work, there are slides on uses in chemistry and biology, a balanced look at advantages and limitations, and a final slide on future developments, such as smaller, faster, and smarter devices.
The layouts are clean, with icons, short text blocks, and easy-to-read visuals, so a technical topic feels simple. Everything is fully editable in PowerPoint and Google Slides, so you can add your own data, update the examples, and match the colours to your school or lab.
Download it, make it yours, and help your audience see how light reveals what’s inside a sample.