Editable Pert Chart Template For Project Presentation Slide

Color coded pert chart slide outlining project stages from the project information to product render with text description.
P.ID : 60846
    797 views
    106 Downloads
    Get Custom Slides by Experts
    Instantly Access Templates in PowerPoint

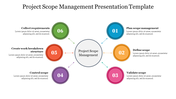
    Stunning Pert Chart In Presentation Slide

    A PERT chart (Program Evaluation and Review Technique) is a graphical tool used in project management to schedule, organize, and coordinate tasks within a project. The chart displays the flow of tasks and their dependencies in a visual format, with arrows connecting each task to its predecessor and successor. PERT charts are particularly useful for large and complex projects, as they help project managers identify critical tasks and the order in which they need to be completed. By estimating the time required for each task and considering potential delays and uncertainties, project managers can create realistic schedules and identify potential risks in advance. Overall, PERT charts help project teams stay organized and on track, improving the chances of project success. You can impress your audience with this sleek template, delivering an informative presentation.

    Features of the template:

    • 100% customizable slide and easy to download. 
    • Easy to change the slide's colors.
    • This slide has a colorful design pattern.
    • Highly compatible with PowerPoint.
    • It supports an aspect ratio of 4:3 and 16:9 format.
    Advertisement

    You May Also Like These PowerPoint Templates

    Free
    Add to Wishlist
    Download
    AI Customize
    Layered pyramid with five sections in different colors, and matching text boxes on the right.
    Add to Wishlist
    Download
    AI Customize
     Colorful puzzle-shaped elements, each featuring icons and editable text spaces related to project management themes.
    Free
    Add to Wishlist
    Download
    AI Customize
    Five colored squares in blue, red, green, teal, and orange with numbers, each with text below.
    Add to Wishlist
    Download
    AI Customize
    Four circular icons above colored number blocks representing steps with icons in red, blue, green, and orange.
    Add to Wishlist
    Download
    AI Customize
    Infographic slide deck showcasing four key software quality factors, each with an icon and color banner.
    Add to Wishlist
    Download
    AI Customize
    Slide deck of hexagonal infographic of a maintenance management system, with icons and colored placeholders.
    Add to Wishlist
    Download
    AI Customize
    Flowchart with curved arrows in multiple colors, showing six steps, each represented by colored boxes and text.
    Add to Wishlist
    Download
    AI Customize
    Infographic style slide illustrating different types of user acceptance testing with colorful labeled sections with an icon.
    Add to Wishlist
    Download
    AI Customize
    Five vertical colored boxes in yellow, blue, red, orange, and green, aligned horizontally, with arrows and labels below.
    Add to Wishlist
    Download
    AI Customize
    Core competencies slide with eight numbered segments in various colors, surrounding a central label.
    Free
    Add to Wishlist
    Download
    AI Customize
    Five step project management process with colored shapes in blue, red, pink, orange, and green, labeled 1 to 5.
    Add to Wishlist
    Download
    AI Customize
    A hexagon with colour coded six sections, for project management each labeled with a caption and placeholder text.
    Add to Wishlist
    Download
    AI Customize
    A row of four document icons in purple, blue, pink, and red, with corresponding descriptions below.
    Add to Wishlist
    Download
    AI Customize
    Image showing a workspace with laptops and a hand writing on a paper, with four types of risks from market,  to operational.
    Add to Wishlist
    Download
    AI Customize
    Scope management slide with six vertical sections. Each section contains placeholder text and arrows at the top and bottom.